Venice SnackAbility
Overall SnackAbility
Crime in Venice summary. We use data from the FBI to determine the crime rates in Venice. Key points include:
There were 362 total crimes in Venice in the last reporting year.
The overall crime rate per 100,000 people in Venice is 1,485.7 / 100k people.
The violent crime rate per 100,000 people in Venice is 65.7 / 100k people.
The property crime rate per 100,000 people in Venice is 1,420.0 / 100k people.
Overall, crime in Venice is -29.90% below the national average.
Total Crimes
Below National Average
Crime In Venice Comparison Table
| Statistic | Count Raw |
Venice / 100k People |
Florida / 100k People |
National / 100k People |
|---|---|---|---|---|
| Total Crimes Per 100K | 362 | 1,485.7 | 1,687.5 | 2,119.2 |
| Violent Crime | 16 | 65.7 | 267.1 | 359.0 |
| Murder | 0 | 0.0 | 3.9 | 5.0 |
| Robbery | 5 | 20.5 | 38.2 | 61.0 |
| Aggravated Assault | 9 | 36.9 | 197.1 | 256.0 |
| Property Crime | 346 | 1,420.0 | 1,420.4 | 1,760.0 |
| Burglary | 56 | 229.8 | 152.5 | 229.0 |
| Larceny | 274 | 1,124.5 | 1,144.9 | 1,272.0 |
| Car Theft | 16 | 65.7 | 123.0 | 259.0 |
Source: FBI Uniform Crime Reporting (2024)
Cost of living in Venice summary. We use data on the cost of living to determine how expensive it is to live in Venice. Real estate prices drive most of the variance in cost of living around Florida. Key points include:
The cost of living in Venice is 118 with 100 being average.
The cost of living in Venice is 1.2x higher than the national average.
The median home value in Venice is $379,805.
The median income in Venice is $76,755.
Venice's Overall Cost Of Living
Higher Than The National Average
Cost Of Living In Venice Comparison Table
| Living Expense | Venice | Florida | National Average |
|---|---|---|---|
| Overall | 118 | 104 | 100 |
| Services | 103 | 101 | 100 |
| Groceries | 100 | 105 | 100 |
| Health | 149 | 99 | 100 |
| Housing | 99 | 104 | 100 |
| Transportation | 113 | 109 | 100 |
| Utilities | 104 | 105 | 100 |
Source: Cost of living index, normalized to US average = 100
Venice, FL Weather
The average high in Venice is 82.3° and the average low is 64.0°.
There are 73.9 days of precipitation each year.
Expect an average of 53.6 inches of precipitation each year with 0.0 inches of snow.
| Stat | Venice |
|---|---|
| Average Annual High | 82.3 |
| Average Annual Low | 64.0 |
| Annual Precipitation Days | 73.9 |
| Average Annual Precipitation | 53.6 |
| Average Annual Snowfall | 0.0 |
Average High
Days of Rain
Source: NOAA climate normals (30-year)
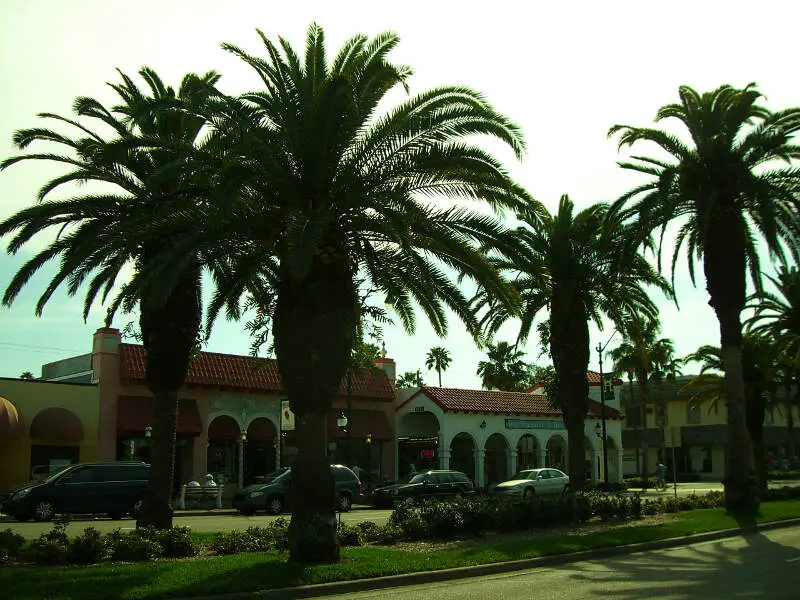
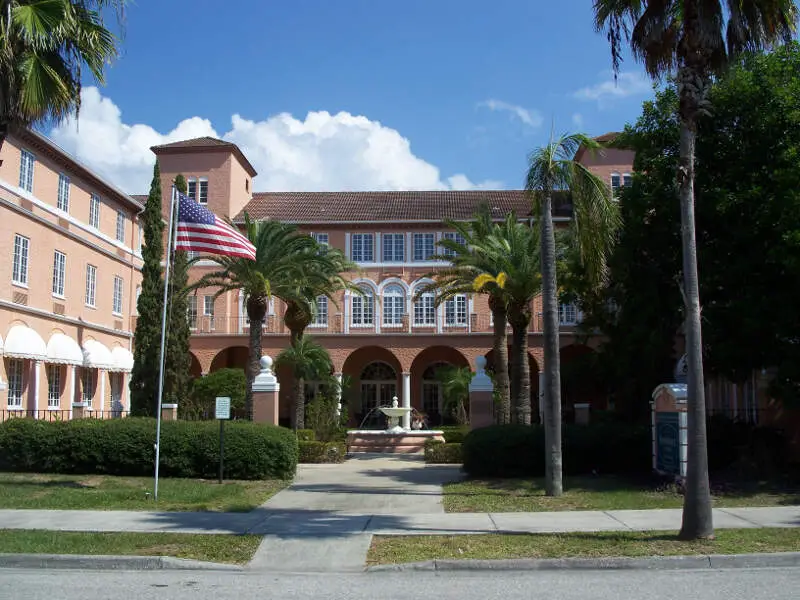
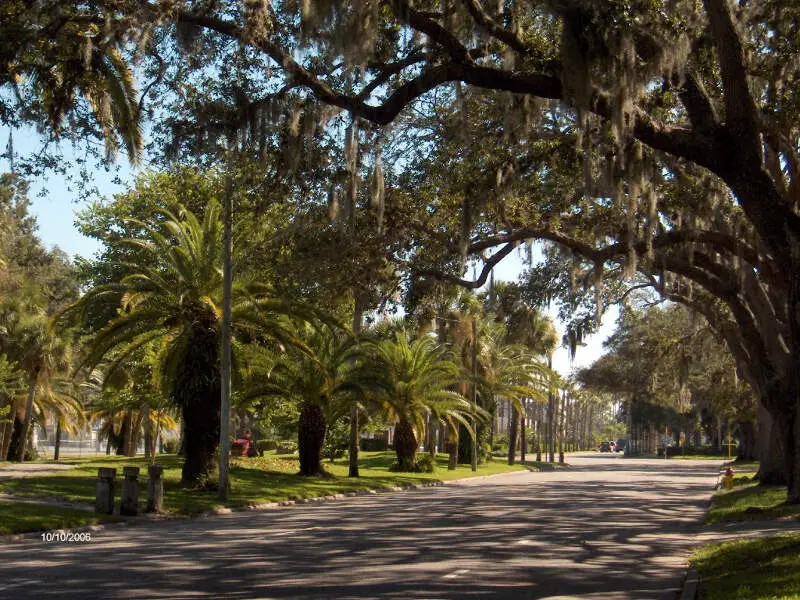
Venice, FL Photos


1 Reviews & Comments About Venice

What I love them Venice Florida it gives you a small town feel with the amenities of everything around you. It is close to many of Florida's pristine beaches. It has a quaint small shopping downtown.
What are the bad things about the area is having to deal with the red tide. It varies on intensity from year to year. It has been known to cause fish kills on the beach which can be very unpleasant to have the fish smell and turns the water and ugly brown color and could cause some respiratory issues.
Rankings & Articles For Venice


Locations Around Venice
Map Of Venice, FL
Best Places Around Venice
Fruitville, FL
Population 15,172
Sarasota Springs, FL
Population 12,611
South Venice, FL
Population 17,484
Sarasota, FL
Population 56,970
Englewood, FL
Population 20,091
North Port, FL
Population 84,605
Grove, OK
Population 7,176
Venice Demographics And Statistics
Population over time in Venice
The current population in Venice is 27,479. The population has increased 32.8% from 2010.
| Year | Population | % Change |
|---|---|---|
| 2024 | 27,479 | 3.8% |
| 2023 | 26,467 | 2.9% |
| 2022 | 25,710 | 3.4% |
| 2021 | 24,876 | 5.5% |
| 2020 | 23,572 | 2.1% |
| 2019 | 23,086 | 2.1% |
| 2018 | 22,601 | 1.8% |
| 2017 | 22,192 | 2.2% |
| 2016 | 21,722 | 1.5% |
| 2015 | 21,402 | 1.3% |
| 2014 | 21,121 | 1.1% |
| 2013 | 20,893 | 0.4% |
| 2012 | 20,803 | 0.2% |
| 2011 | 20,760 | 0.4% |
| 2010 | 20,687 | - |
Race / Ethnicity in Venice
See the full breakdown
Venice is:
87.4% White with 24,026 White residents.
1.2% African American with 322 African American residents.
0.1% American Indian with 14 American Indian residents.
2.1% Asian with 579 Asian residents.
0.0% Hawaiian with 0 Hawaiian residents.
0.3% Other with 75 Other residents.
3.0% Two Or More with 827 Two Or More residents.
6.0% Hispanic with 1,636 Hispanic residents.
| Race | Venice | FL | USA |
|---|---|---|---|
| White | 87.4% | 50.4% | 57.4% |
| African American | 1.2% | 14.6% | 11.9% |
| American Indian | 0.1% | 0.1% | 0.5% |
| Asian | 2.1% | 2.9% | 5.9% |
| Hawaiian | 0.0% | 0.1% | 0.2% |
| Other | 0.3% | 0.7% | 0.6% |
| Two Or More | 3.0% | 3.8% | 4.3% |
| Hispanic | 6.0% | 27.4% | 19.3% |
Gender in Venice
See the full breakdown
Venice is 55.1% female with 15,133 female residents.
Venice is 44.9% male with 12,345 male residents.
| Gender | Venice | FL | USA |
|---|---|---|---|
| Female | 55.1% | 50.9% | 50.5% |
| Male | 44.9% | 49.1% | 49.5% |
Highest level of educational attainment in Venice for adults over 25
See the full breakdown
3.0% of adults in Venice completed < 9th grade.
2.0% of adults in Venice completed 9-12th grade.
22.0% of adults in Venice completed high school / ged.
18.0% of adults in Venice completed some college.
9.0% of adults in Venice completed associate's degree.
26.0% of adults in Venice completed bachelor's degree.
15.0% of adults in Venice completed master's degree.
3.0% of adults in Venice completed professional degree.
2.0% of adults in Venice completed doctorate degree.
| Education | Venice | FL | USA |
|---|---|---|---|
| < 9th Grade | 3.0% | 5.0% | 4.0% |
| 9-12th Grade | 2.0% | 6.0% | 6.0% |
| High School / GED | 22.0% | 27.0% | 26.0% |
| Some College | 18.0% | 19.0% | 19.0% |
| Associate's Degree | 9.0% | 10.0% | 9.0% |
| Bachelor's Degree | 26.0% | 21.0% | 22.0% |
| Master's Degree | 15.0% | 9.0% | 10.0% |
| Professional Degree | 3.0% | 2.0% | 2.0% |
| Doctorate Degree | 2.0% | 1.0% | 2.0% |
Household Income For Venice, Florida
See the full breakdown
5.5% of households in Venice earn Less than $10,000.
3.6% of households in Venice earn $10,000 to $14,999.
6.8% of households in Venice earn $15,000 to $24,999.
5.7% of households in Venice earn $25,000 to $34,999.
10.1% of households in Venice earn $35,000 to $49,999.
17.2% of households in Venice earn $50,000 to $74,999.
12.8% of households in Venice earn $75,000 to $99,999.
19.2% of households in Venice earn $100,000 to $149,999.
6.2% of households in Venice earn $150,000 to $199,999.
12.9% of households in Venice earn $200,000 or more.
| Income | Venice | FL | USA |
|---|---|---|---|
| Less than $10,000 | 5.5% | 5.1% | 5.0% |
| $10,000 to $14,999 | 3.6% | 3.3% | 3.4% |
| $15,000 to $24,999 | 6.8% | 6.6% | 6.3% |
| $25,000 to $34,999 | 5.7% | 7.3% | 6.6% |
| $35,000 to $49,999 | 10.1% | 11.1% | 10.1% |
| $50,000 to $74,999 | 17.2% | 16.8% | 15.5% |
| $75,000 to $99,999 | 12.8% | 13.1% | 12.6% |
| $100,000 to $149,999 | 19.2% | 17.2% | 17.5% |
| $150,000 to $199,999 | 6.2% | 8.4% | 9.6% |
| $200,000 or more | 12.9% | 11.0% | 13.4% |
Source: U.S. Census ACS 5-year estimates (2024)


