Ankeny SnackAbility
Overall SnackAbility
Crime in Ankeny summary. We use data from the FBI to determine the crime rates in Ankeny. Key points include:
There were 909 total crimes in Ankeny in the last reporting year.
The overall crime rate per 100,000 people in Ankeny is 1,187.5 / 100k people.
The violent crime rate per 100,000 people in Ankeny is 165.9 / 100k people.
The property crime rate per 100,000 people in Ankeny is 1,021.6 / 100k people.
Overall, crime in Ankeny is -43.97% below the national average.
Total Crimes
Below National Average
Crime In Ankeny Comparison Table
| Statistic | Count Raw |
Ankeny / 100k People |
Iowa / 100k People |
National / 100k People |
|---|---|---|---|---|
| Total Crimes Per 100K | 909 | 1,187.5 | 1,540.0 | 2,119.2 |
| Violent Crime | 127 | 165.9 | 243.3 | 359.0 |
| Murder | 0 | 0.0 | 2.1 | 5.0 |
| Robbery | 5 | 6.5 | 18.7 | 61.0 |
| Aggravated Assault | 91 | 118.9 | 187.2 | 256.0 |
| Property Crime | 782 | 1,021.6 | 1,296.8 | 1,760.0 |
| Burglary | 49 | 64.0 | 199.1 | 229.0 |
| Larceny | 668 | 872.7 | 962.6 | 1,272.0 |
| Car Theft | 65 | 84.9 | 135.1 | 259.0 |
Source: FBI Uniform Crime Reporting (2024)
Cost of living in Ankeny summary. We use data on the cost of living to determine how expensive it is to live in Ankeny. Real estate prices drive most of the variance in cost of living around Iowa. Key points include:
The cost of living in Ankeny is 106 with 100 being average.
The cost of living in Ankeny is 1.1x higher than the national average.
The median home value in Ankeny is $338,168.
The median income in Ankeny is $108,198.
Ankeny's Overall Cost Of Living
Higher Than The National Average
Cost Of Living In Ankeny Comparison Table
| Living Expense | Ankeny | Iowa | National Average |
|---|---|---|---|
| Overall | 106 | 90 | 100 |
| Services | 97 | 99 | 100 |
| Groceries | 96 | 95 | 100 |
| Health | 128 | 75 | 100 |
| Housing | 94 | 97 | 100 |
| Transportation | 99 | 93 | 100 |
| Utilities | 92 | 94 | 100 |
Source: Cost of living index, normalized to US average = 100
Ankeny, IA Weather
The average high in Ankeny is 59.5° and the average low is 39.1°.
There are 63.1 days of precipitation each year.
Expect an average of 35.5 inches of precipitation each year with 30.8 inches of snow.
| Stat | Ankeny |
|---|---|
| Average Annual High | 59.5 |
| Average Annual Low | 39.1 |
| Annual Precipitation Days | 63.1 |
| Average Annual Precipitation | 35.5 |
| Average Annual Snowfall | 30.8 |
Average High
Days of Rain
Source: NOAA climate normals (30-year)
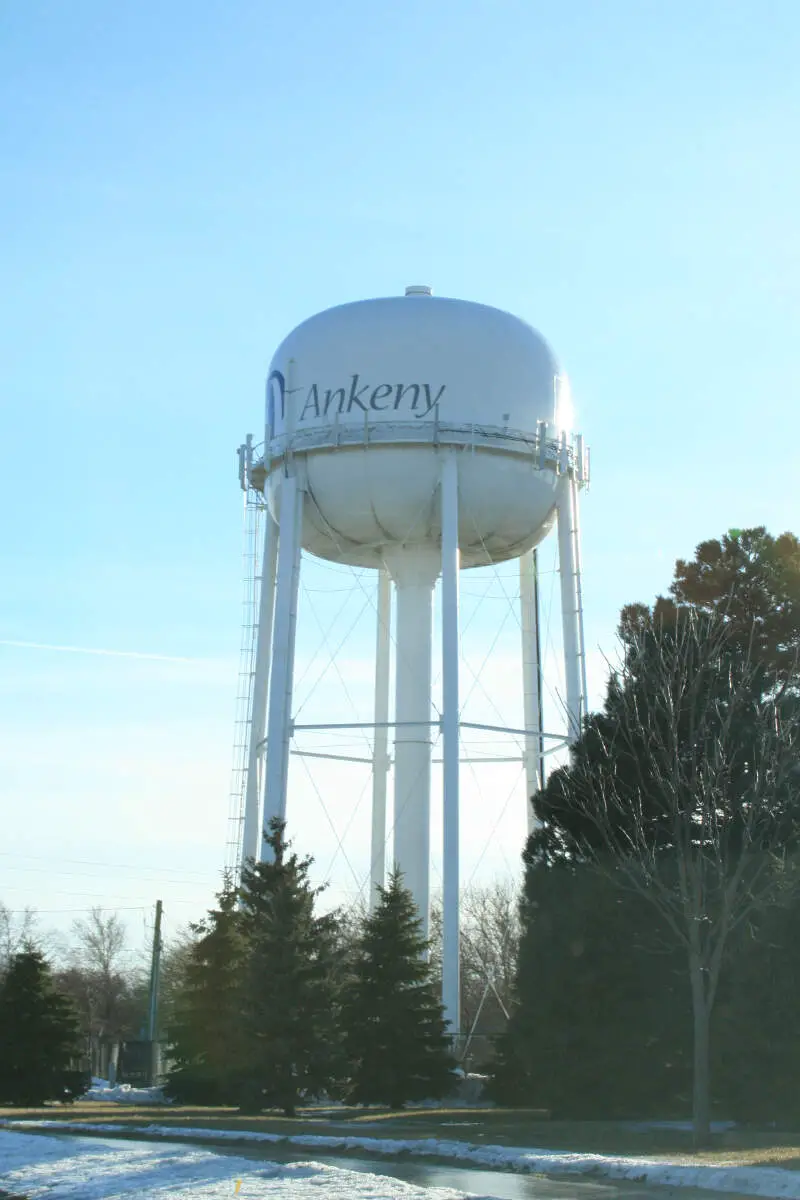
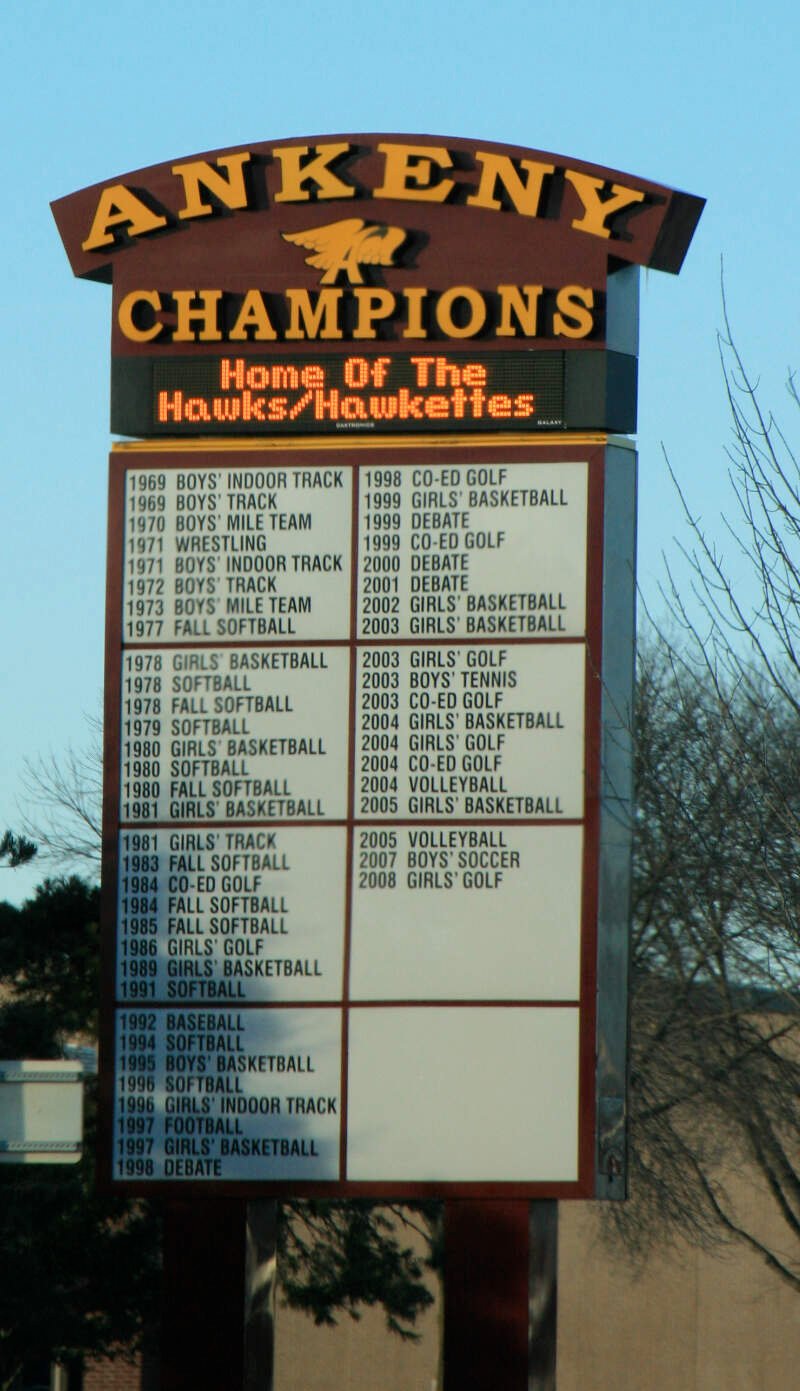
Ankeny, IA Photos


Rankings & Articles For Ankeny


Locations Around Ankeny
Map Of Ankeny, IA
Best Places Around Ankeny
Urbandale, IA
Population 46,595
Clive, IA
Population 19,012
West Des Moines, IA
Population 71,083
Johnston, IA
Population 24,384
Norwalk, IA
Population 14,183
Altoona, IA
Population 21,495
Waukee, IA
Population 29,236
Grimes, IA
Population 16,366
Pleasant Hill, IA
Population 11,136
Des Moines, IA
Population 212,421
Ankeny Demographics And Statistics
Population over time in Ankeny
The current population in Ankeny is 72,615. The population has increased 72.0% from 2010.
| Year | Population | % Change |
|---|---|---|
| 2024 | 72,615 | 2.9% |
| 2023 | 70,542 | 3.1% |
| 2022 | 68,392 | 3.1% |
| 2021 | 66,346 | 2.5% |
| 2020 | 64,744 | 4.5% |
| 2019 | 61,938 | 4.7% |
| 2018 | 59,152 | 5.2% |
| 2017 | 56,237 | 5.3% |
| 2016 | 53,413 | 3.7% |
| 2015 | 51,489 | 4.0% |
| 2014 | 49,488 | 4.0% |
| 2013 | 47,586 | 4.1% |
| 2012 | 45,732 | 4.5% |
| 2011 | 43,767 | 3.7% |
| 2010 | 42,211 | - |
Race / Ethnicity in Ankeny
See the full breakdown
Ankeny is:
85.7% White with 62,213 White residents.
2.5% African American with 1,807 African American residents.
0.0% American Indian with 5 American Indian residents.
3.5% Asian with 2,538 Asian residents.
0.0% Hawaiian with 0 Hawaiian residents.
0.2% Other with 110 Other residents.
3.1% Two Or More with 2,269 Two Or More residents.
5.1% Hispanic with 3,673 Hispanic residents.
| Race | Ankeny | IA | USA |
|---|---|---|---|
| White | 85.7% | 82.3% | 57.4% |
| African American | 2.5% | 3.8% | 11.9% |
| American Indian | 0.0% | 0.2% | 0.5% |
| Asian | 3.5% | 2.5% | 5.9% |
| Hawaiian | 0.0% | 0.2% | 0.2% |
| Other | 0.2% | 0.3% | 0.6% |
| Two Or More | 3.1% | 3.5% | 4.3% |
| Hispanic | 5.1% | 7.3% | 19.3% |
Gender in Ankeny
See the full breakdown
Ankeny is 50.3% female with 36,559 female residents.
Ankeny is 49.7% male with 36,056 male residents.
| Gender | Ankeny | IA | USA |
|---|---|---|---|
| Female | 50.3% | 49.8% | 50.5% |
| Male | 49.7% | 50.2% | 49.5% |
Highest level of educational attainment in Ankeny for adults over 25
See the full breakdown
0.0% of adults in Ankeny completed < 9th grade.
1.0% of adults in Ankeny completed 9-12th grade.
17.0% of adults in Ankeny completed high school / ged.
18.0% of adults in Ankeny completed some college.
11.0% of adults in Ankeny completed associate's degree.
36.0% of adults in Ankeny completed bachelor's degree.
13.0% of adults in Ankeny completed master's degree.
2.0% of adults in Ankeny completed professional degree.
2.0% of adults in Ankeny completed doctorate degree.
| Education | Ankeny | IA | USA |
|---|---|---|---|
| < 9th Grade | 0.0% | 3.0% | 4.0% |
| 9-12th Grade | 1.0% | 4.0% | 6.0% |
| High School / GED | 17.0% | 30.0% | 26.0% |
| Some College | 18.0% | 20.0% | 19.0% |
| Associate's Degree | 11.0% | 12.0% | 9.0% |
| Bachelor's Degree | 36.0% | 21.0% | 22.0% |
| Master's Degree | 13.0% | 7.0% | 10.0% |
| Professional Degree | 2.0% | 2.0% | 2.0% |
| Doctorate Degree | 2.0% | 1.0% | 2.0% |
Household Income For Ankeny, Iowa
See the full breakdown
2.1% of households in Ankeny earn Less than $10,000.
1.2% of households in Ankeny earn $10,000 to $14,999.
3.0% of households in Ankeny earn $15,000 to $24,999.
4.9% of households in Ankeny earn $25,000 to $34,999.
6.7% of households in Ankeny earn $35,000 to $49,999.
15.2% of households in Ankeny earn $50,000 to $74,999.
13.2% of households in Ankeny earn $75,000 to $99,999.
21.8% of households in Ankeny earn $100,000 to $149,999.
17.6% of households in Ankeny earn $150,000 to $199,999.
14.3% of households in Ankeny earn $200,000 or more.
| Income | Ankeny | IA | USA |
|---|---|---|---|
| Less than $10,000 | 2.1% | 4.0% | 5.0% |
| $10,000 to $14,999 | 1.2% | 3.2% | 3.4% |
| $15,000 to $24,999 | 3.0% | 6.7% | 6.3% |
| $25,000 to $34,999 | 4.9% | 7.2% | 6.6% |
| $35,000 to $49,999 | 6.7% | 11.3% | 10.1% |
| $50,000 to $74,999 | 15.2% | 17.5% | 15.5% |
| $75,000 to $99,999 | 13.2% | 14.0% | 12.6% |
| $100,000 to $149,999 | 21.8% | 18.7% | 17.5% |
| $150,000 to $199,999 | 17.6% | 8.8% | 9.6% |
| $200,000 or more | 14.3% | 8.6% | 13.4% |
Source: U.S. Census ACS 5-year estimates (2024)


