100 Biggest Cities In Iowa For 2026
Using the latest Census data, we detail the 100 biggest cities in Iowa. You can all see a comprehensive list of all 279 cities and places in Iowa.

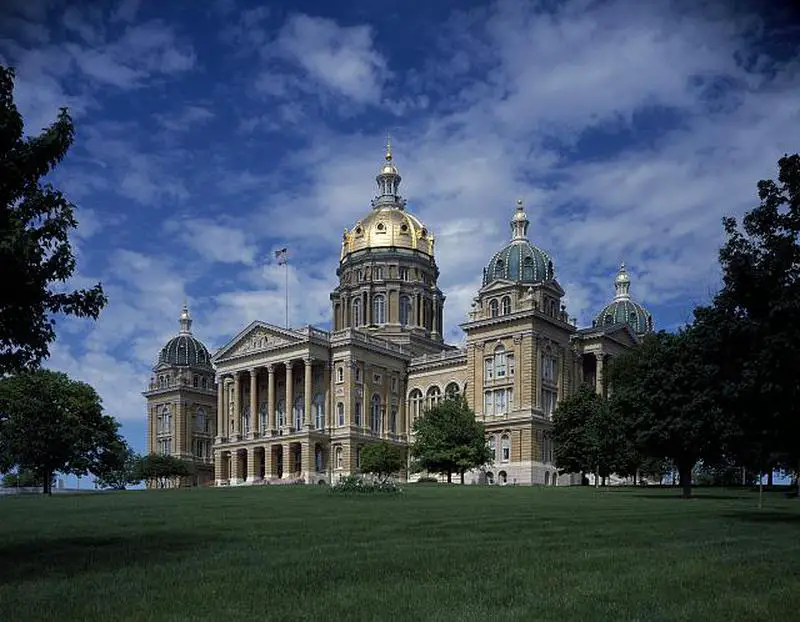
We all love the biggest cities that the Hawkeye State has to offer. You know the places like Des Moines and Cedar Rapids which make all the headlines.
But there are a bunch of other great large cities in Iowa that don't get as much love.
We're going to change that right now.
Using the most recent Census data, we can tell you about all the places in Iowa with a focus on the biggest. We update the data each year and this is our fourth time doing this.
Table Of Contents: Top Ten | Methodology | Table
The Largest Cities In Iowa For 2026:
You can click here to see a full table of the full of the 100 biggest cities in Iowa, along with every other place over 1,000 people big. It is sortable by clicking on the headers.
Read on below to see more on the biggest cities. Or for more reading on places to live in Iowa, check out:
The 10 Biggest Cities In Iowa

/10
Rank Last Year: 1 (No Change)
Population: 212,421.0
Population 2010: 202,095
Growth: 5.1%
More on Des Moines: Data | Crime | Cost Of Living | Real Estate

/10
Rank Last Year: 2 (No Change)
Population: 137,264.0
Population 2010: 125,450
Growth: 9.4%
More on Cedar Rapids: Data | Crime | Cost Of Living | Real Estate

/10
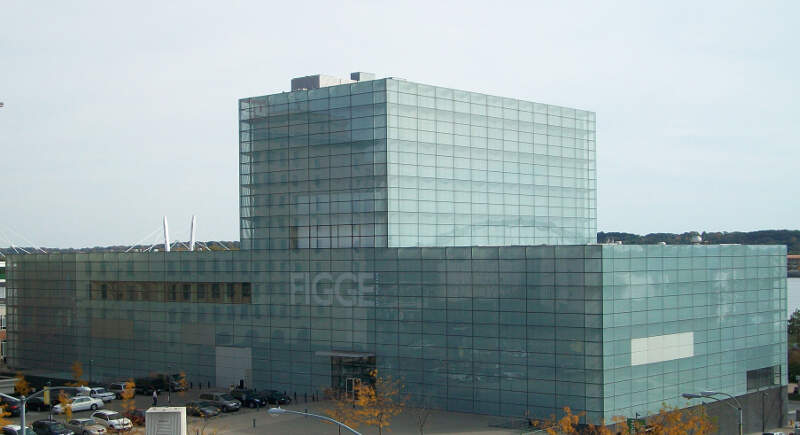
Rank Last Year: 3 (No Change)
Population: 100,913.0
Population 2010: 98,325
Growth: 2.6%
More on Davenport: Data | Crime | Cost Of Living | Real Estate
/10
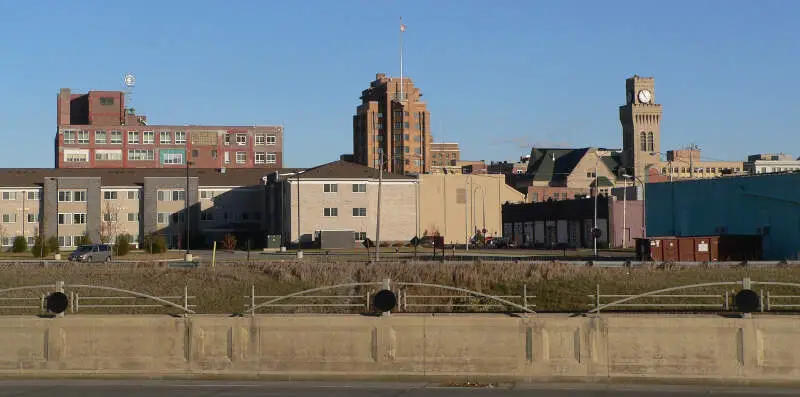
Rank Last Year: 4 (No Change)
Population: 86,101.0
Population 2010: 82,106
Growth: 4.9%
More on Sioux City: Data | Crime | Cost Of Living | Real Estate


/10
Rank Last Year: 5 (No Change)
Population: 75,752.0
Population 2010: 66,758
Growth: 13.5%
More on Iowa City: Data | Crime | Cost Of Living | Real Estate

/10
Rank Last Year: 6 (No Change)
Population: 72,615.0
Population 2010: 42,211
Growth: 72.0%
More on Ankeny: Data | Crime | Cost Of Living | Real Estate

/10
Rank Last Year: 7 (No Change)
Population: 71,083.0
Population 2010: 54,731
Growth: 29.9%
More on West Des Moines: Data | Crime | Cost Of Living | Real Estate

/10
Rank Last Year: 9 (Up 1)
Population: 67,669.0
Population 2010: 57,343
Growth: 18.0%
More on Ames: Data | Crime | Cost Of Living | Real Estate

/10
Rank Last Year: 8 (Down 1)
Population: 67,008.0
Population 2010: 67,893
Growth: -1.3%
More on Waterloo: Data | Crime | Cost Of Living | Real Estate

/10
Rank Last Year: 10 (No Change)
Population: 62,586.0
Population 2010: 61,340
Growth: 2.0%
More on Council Bluffs: Data | Crime | Cost Of Living | Real Estate
How We Determined The Largest Cities In Iowa
We've been ranking and dissecting cities in the Hawkeye State for over 4 years now -- making this actually the fourth time we've run the numbers. We always use the best data, the US Census. In this case, that means we are using the American Community Survey.
It what is probably the most simple analysis we run each year, we ranked every place in Iowa from biggest to smallest. The biggest city this year? That would be Des Moines.
The smallest? Winfield, although there are places smaller than 1,000 people not listed here, so keep that in mind as we take a look at the top ten.
Now on to numbers 11-100 Biggest in Iowa
We hope that you find the big city, or really any city, that's right for you. Below is a list of the rest of the biggest cities along with every other place in Iowa.
Have fun snacking around in the Hawkeye State!
For more reading on Iowa, check out:
- Best Places To Raise A Family In Iowa
- Best Places To Retire In Iowa
- Richest Cities In Iowa
- Safest Places In Iowa
- Worst Places To Live In Iowa
- Most Expensive Places To Live In Iowa
Detailed List Of The Biggest Cities In Iowa
| Rank | City | Current Population | 2010 | Growth | |||||
|---|---|---|---|---|---|---|---|---|---|
| 1 | Des Moines | 212,421.0 | 202,095 | 5.1% | |||||
| 2 | Cedar Rapids | 137,264.0 | 125,450 | 9.4% | |||||
| 3 | Davenport | 100,913.0 | 98,325 | 2.6% | |||||
| 4 | Sioux City | 86,101.0 | 82,106 | 4.9% | |||||
| 5 | Iowa City | 75,752.0 | 66,758 | 13.5% | |||||
| 6 | Ankeny | 72,615.0 | 42,211 | 72.0% | |||||
| 7 | West Des Moines | 71,083.0 | 54,731 | 29.9% | |||||
| 8 | Ames | 67,669.0 | 57,343 | 18.0% | |||||
| 9 | Waterloo | 67,008.0 | 67,893 | -1.3% | |||||
| 10 | Council Bluffs | 62,586.0 | 61,340 | 2.0% | |||||
| 11 | Dubuque | 59,174.0 | 57,504 | 2.9% | |||||
| 12 | Urbandale | 46,595.0 | 37,503 | 24.2% | |||||
| 13 | Marion | 41,896.0 | 33,293 | 25.8% | |||||
| 14 | Cedar Falls | 40,888.0 | 38,178 | 7.1% | |||||
| 15 | Bettendorf | 39,647.0 | 32,490 | 22.0% | |||||
| 16 | Waukee | 29,236.0 | 12,305 | 137.6% | |||||
| 17 | Marshalltown | 27,626.0 | 27,096 | 2.0% | |||||
| 18 | Mason City | 27,050.0 | 28,125 | -3.8% | |||||
| 19 | Ottumwa | 25,430.0 | 24,889 | 2.2% | |||||
| 20 | Fort Dodge | 24,827.0 | 25,323 | -2.0% | |||||
| 21 | Johnston | 24,384.0 | 15,723 | 55.1% | |||||
| 22 | Clinton | 24,322.0 | 27,016 | -10.0% | |||||
| 23 | Burlington | 23,728.0 | 25,604 | -7.3% | |||||
| 24 | Muscatine | 23,489.0 | 22,819 | 2.9% | |||||
| 25 | Coralville | 23,234.0 | 18,186 | 27.8% | |||||
| 26 | Altoona | 21,495.0 | 13,757 | 56.2% | |||||
| 27 | North Liberty | 21,125.0 | 11,889 | 77.7% | |||||
| 28 | Clive | 19,012.0 | 14,950 | 27.2% | |||||
| 29 | Grimes | 16,366.0 | 7,653 | 113.9% | |||||
| 30 | Indianola | 16,044.0 | 14,546 | 10.3% | |||||
| 31 | Newton | 15,700.0 | 15,371 | 2.1% | |||||
| 32 | Norwalk | 14,183.0 | 8,622 | 64.5% | |||||
| 33 | Boone | 12,424.0 | 12,764 | -2.7% | |||||
| 34 | Oskaloosa | 11,504.0 | 11,393 | 1.0% | |||||
| 35 | Storm Lake | 11,428.0 | 10,357 | 10.3% | |||||
| 36 | Spencer | 11,400.0 | 11,193 | 1.8% | |||||
| 37 | Pleasant Hill | 11,136.0 | 8,100 | 37.5% | |||||
| 38 | Pella | 10,720.0 | 10,359 | 3.5% | |||||
| 39 | Le Mars | 10,640.0 | 9,719 | 9.5% | |||||
| 40 | Waverly | 10,494.0 | 9,754 | 7.6% | |||||
| 41 | Carroll | 10,208.0 | 10,047 | 1.6% | |||||
| 42 | Fort Madison | 10,133.0 | 11,096 | -8.7% | |||||
| 43 | Keokuk | 9,662.0 | 10,802 | -10.6% | |||||
| 44 | Grinnell | 9,505.0 | 9,265 | 2.6% | |||||
| 45 | Fairfield | 9,456.0 | 9,451 | 0.1% | |||||
| 46 | Mount Pleasant | 8,951.0 | 8,743 | 2.4% | |||||
| 47 | Bondurant | 8,560.0 | 3,486 | 145.6% | |||||
| 48 | Sioux Center | 8,454.0 | 6,916 | 22.2% | |||||
| 49 | Denison | 8,260.0 | 8,077 | 2.3% | |||||
| 50 | Perry | 7,985.0 | 7,706 | 3.6% | |||||
| 51 | Webster City | 7,769.0 | 8,125 | -4.4% | |||||
| 52 | Clear Lake | 7,607.0 | 7,799 | -2.5% | |||||
| 53 | Decorah | 7,535.0 | 8,115 | -7.1% | |||||
| 54 | Knoxville | 7,473.0 | 7,459 | 0.2% | |||||
| 55 | Creston | 7,435.0 | 7,738 | -3.9% | |||||
| 56 | Washington | 7,290.0 | 7,261 | 0.4% | |||||
| 57 | Charles City | 7,232.0 | 7,667 | -5.7% | |||||
| 58 | Hiawatha | 7,206.0 | 6,932 | 4.0% | |||||
| 59 | Nevada | 6,983.0 | 6,753 | 3.4% | |||||
| 60 | Eldridge | 6,818.0 | 5,319 | 28.2% | |||||
| 61 | Atlantic | 6,763.0 | 7,078 | -4.5% | |||||
| 62 | Adel | 6,430.0 | 3,640 | 76.6% | |||||
| 63 | Orange City | 6,426.0 | 5,967 | 7.7% | |||||
| 64 | Independence | 6,164.0 | 5,987 | 3.0% | |||||
| 65 | Maquoketa | 6,075.0 | 6,135 | -1.0% | |||||
| 66 | Polk City | 6,037.0 | 3,231 | 86.8% | |||||
| 67 | Asbury | 5,989.0 | 3,852 | 55.5% | |||||
| 68 | Estherville | 5,839.0 | 6,388 | -8.6% | |||||
| 69 | Oelwein | 5,834.0 | 6,433 | -9.3% | |||||
| 70 | Tiffin | 5,737.0 | 1,986 | 188.9% | |||||
| 71 | Anamosa | 5,629.0 | 5,634 | -0.1% | |||||
| 72 | Osceola | 5,523.0 | 4,878 | 13.2% | |||||
| 73 | Spirit Lake | 5,518.0 | 4,749 | 16.2% | |||||
| 74 | Red Oak | 5,510.0 | 5,814 | -5.2% | |||||
| 75 | Sheldon | 5,474.0 | 5,046 | 8.5% | |||||
| 76 | Winterset | 5,416.0 | 5,138 | 5.4% | |||||
| 77 | Algona | 5,377.0 | 5,569 | -3.4% | |||||
| 78 | Centerville | 5,372.0 | 5,593 | -4.0% | |||||
| 79 | Clarinda | 5,353.0 | 5,566 | -3.8% | |||||
| 80 | Manchester | 5,191.0 | 5,187 | 0.1% | |||||
| 81 | Sergeant Bluff | 5,171.0 | 4,031 | 28.3% | |||||
| 82 | Cherokee | 5,154.0 | 5,205 | -1.0% | |||||
| 83 | Glenwood | 5,144.0 | 5,354 | -3.9% | |||||
| 84 | Windsor Heights | 5,143.0 | 4,835 | 6.4% | |||||
| 85 | Iowa Falls | 5,038.0 | 5,195 | -3.0% | |||||
| 86 | Vinton | 4,948.0 | 5,262 | -6.0% | |||||
| 87 | Shenandoah | 4,892.0 | 5,222 | -6.3% | |||||
| 88 | Harlan | 4,891.0 | 5,140 | -4.8% | |||||
| 89 | Humboldt | 4,771.0 | 4,648 | 2.6% | |||||
| 90 | Le Claire | 4,735.0 | 3,561 | 33.0% | |||||
| 91 | Camanche | 4,550.0 | 4,403 | 3.3% | |||||
| 92 | Huxley | 4,544.0 | 3,132 | 45.1% | |||||
| 93 | Evansdale | 4,518.0 | 4,666 | -3.2% | |||||
| 94 | Mount Vernon | 4,513.0 | 4,375 | 3.2% | |||||
| 95 | Dyersville | 4,423.0 | 4,070 | 8.7% | |||||
| 96 | Hampton | 4,306.0 | 4,420 | -2.6% | |||||
| 97 | Forest City | 4,290.0 | 4,160 | 3.1% | |||||
| 98 | Carlisle | 4,255.0 | 3,775 | 12.7% | |||||
| 99 | Chariton | 4,242.0 | 4,429 | -4.2% | |||||
| 100 | Jefferson | 4,152.0 | 4,360 | -4.8% | |||||
| 101 | Monticello | 4,071.0 | 3,785 | 7.6% | |||||
| 102 | Rock Valley | 4,059.0 | 3,274 | 24.0% | |||||
| 103 | Cresco | 3,908.0 | 3,867 | 1.1% | |||||
| 104 | Waukon | 3,792.0 | 3,931 | -3.5% | |||||
| 105 | West Liberty | 3,776.0 | 3,659 | 3.2% | |||||
| 106 | Carter Lake | 3,767.0 | 3,676 | 2.5% | |||||
| 107 | Albia | 3,663.0 | 3,746 | -2.2% | |||||
| 108 | Emmetsburg | 3,648.0 | 3,898 | -6.4% | |||||
| 109 | Eagle Grove | 3,593.0 | 3,601 | -0.2% | |||||
| 110 | Osage | 3,561.0 | 3,597 | -1.0% | |||||
| 111 | New Hampton | 3,453.0 | 3,585 | -3.7% | |||||
| 112 | Story City | 3,398.0 | 3,393 | 0.1% | |||||
| 113 | Saylorville | 3,366.0 | 3,105 | 8.4% | |||||
| 114 | Williamsburg | 3,360.0 | 3,015 | 11.4% | |||||
| 115 | Robins | 3,332.0 | 2,906 | 14.7% | |||||
| 116 | Milford | 3,311.0 | 2,844 | 16.4% | |||||
| 117 | West Burlington | 3,189.0 | 2,977 | 7.1% | |||||
| 118 | Solon | 3,152.0 | 1,924 | 63.8% | |||||
| 119 | Tipton | 3,106.0 | 3,209 | -3.2% | |||||
| 120 | Tama | 3,051.0 | 2,870 | 6.3% | |||||
| 121 | Garner | 3,049.0 | 3,102 | -1.7% | |||||
| 122 | Postville | 2,979.0 | 1,996 | 49.2% | |||||
| 123 | Wilton | 2,920.0 | 2,801 | 4.2% | |||||
| 124 | Fairfax | 2,900.0 | 1,641 | 76.7% | |||||
| 125 | Onawa | 2,839.0 | 3,005 | -5.5% | |||||
| 126 | Grundy Center | 2,809.0 | 2,673 | 5.1% | |||||
| 127 | Madrid | 2,808.0 | 2,505 | 12.1% | |||||
| 128 | Sibley | 2,803.0 | 2,804 | -0.0% | |||||
| 129 | Clarion | 2,770.0 | 2,861 | -3.2% | |||||
| 130 | Bloomfield | 2,742.0 | 2,630 | 4.3% | |||||
| 131 | Marengo | 2,725.0 | 2,546 | 7.0% | |||||
| 132 | Hudson | 2,699.0 | 2,334 | 15.6% | |||||
| 133 | Belmond | 2,694.0 | 2,287 | 17.8% | |||||
| 134 | Kalona | 2,692.0 | 2,449 | 9.9% | |||||
| 135 | Missouri Valley | 2,666.0 | 2,886 | -7.6% | |||||
| 136 | Rock Rapids | 2,661.0 | 2,537 | 4.9% | |||||
| 137 | Hawarden | 2,658.0 | 2,536 | 4.8% | |||||
| 138 | Eldora | 2,617.0 | 2,774 | -5.7% | |||||
| 139 | West Branch | 2,594.0 | 2,468 | 5.1% | |||||
| 140 | Mitchellville | 2,579.0 | 2,529 | 2.0% | |||||
| 141 | Center Point | 2,562.0 | 2,428 | 5.5% | |||||
| 142 | Jesup | 2,561.0 | 2,592 | -1.2% | |||||
| 143 | West Union | 2,489.0 | 2,614 | -4.8% | |||||
| 144 | Park View | 2,437.0 | 2,428 | 0.4% | |||||
| 145 | Rockwell City | 2,401.0 | 2,357 | 1.9% | |||||
| 146 | Belle Plaine | 2,380.0 | 2,607 | -8.7% | |||||
| 147 | Denver | 2,379.0 | 1,827 | 30.2% | |||||
| 148 | Cascade | 2,375.0 | 2,272 | 4.5% | |||||
| 149 | New London | 2,338.0 | 1,760 | 32.8% | |||||
| 150 | Hull | 2,317.0 | 1,955 | 18.5% | |||||
| 151 | Bellevue | 2,259.0 | 2,289 | -1.3% | |||||
| 152 | Alta | 2,250.0 | 1,917 | 17.4% | |||||
| 153 | Atkins | 2,225.0 | 1,719 | 29.4% | |||||
| 154 | Colfax | 2,210.0 | 2,743 | -19.4% | |||||
| 155 | Lamoni | 2,207.0 | 2,501 | -11.8% | |||||
| 156 | Ely | 2,186.0 | 1,624 | 34.6% | |||||
| 157 | Dallas Center | 2,161.0 | 2,085 | 3.6% | |||||
| 158 | Audubon | 2,130.0 | 2,177 | -2.2% | |||||
| 159 | Monroe | 2,120.0 | 1,868 | 13.5% | |||||
| 160 | Columbus Junction | 2,110.0 | 2,024 | 4.2% | |||||
| 161 | Sumner | 2,106.0 | 2,031 | 3.7% | |||||
| 162 | Lake Mills | 2,088.0 | 2,162 | -3.4% | |||||
| 163 | La Porte City | 2,071.0 | 2,637 | -21.5% | |||||
| 164 | Peosta | 2,040.0 | 1,511 | 35.0% | |||||
| 165 | Northwood | 2,040.0 | 1,962 | 4.0% | |||||
| 166 | Granger | 1,979.0 | 1,035 | 91.2% | |||||
| 167 | Blue Grass | 1,972.0 | 1,382 | 42.7% | |||||
| 168 | Ida Grove | 1,967.0 | 2,158 | -8.9% | |||||
| 169 | Toledo | 1,966.0 | 2,595 | -24.2% | |||||
| 170 | Sigourney | 1,954.0 | 2,101 | -7.0% | |||||
| 171 | Durant | 1,946.0 | 1,907 | 2.0% | |||||
| 172 | Mediapolis | 1,928.0 | 1,812 | 6.4% | |||||
| 173 | Leon | 1,899.0 | 2,105 | -9.8% | |||||
| 174 | Pleasantville | 1,899.0 | 1,605 | 18.3% | |||||
| 175 | Greenfield | 1,894.0 | 1,973 | -4.0% | |||||
| 176 | Epworth | 1,894.0 | 1,809 | 4.7% | |||||
| 177 | Farley | 1,889.0 | 1,508 | 25.3% | |||||
| 178 | Sac City | 1,885.0 | 2,294 | -17.8% | |||||
| 179 | Britt | 1,882.0 | 2,110 | -10.8% | |||||
| 180 | Ogden | 1,859.0 | 2,410 | -22.9% | |||||
| 181 | Remsen | 1,823.0 | 2,018 | -9.7% | |||||
| 182 | Mount Ayr | 1,816.0 | 1,659 | 9.5% | |||||
| 183 | Guttenberg | 1,782.0 | 1,784 | -0.1% | |||||
| 184 | Parkersburg | 1,766.0 | 1,947 | -9.3% | |||||
| 185 | Wapello | 1,765.0 | 2,343 | -24.7% | |||||
| 186 | Pocahontas | 1,763.0 | 1,698 | 3.8% | |||||
| 187 | Walcott | 1,725.0 | 1,570 | 9.9% | |||||
| 188 | Reinbeck | 1,715.0 | 1,963 | -12.6% | |||||
| 189 | Lisbon | 1,714.0 | 1,885 | -9.1% | |||||
| 190 | Prairie City | 1,711.0 | 1,311 | 30.5% | |||||
| 191 | Lake City | 1,693.0 | 1,682 | 0.7% | |||||
| 192 | Guthrie Center | 1,689.0 | 1,562 | 8.1% | |||||
| 193 | Akron | 1,689.0 | 1,512 | 11.7% | |||||
| 194 | Moville | 1,670.0 | 1,743 | -4.2% | |||||
| 195 | Stuart | 1,655.0 | 1,649 | 0.4% | |||||
| 196 | Manson | 1,645.0 | 1,648 | -0.2% | |||||
| 197 | Urbana | 1,639.0 | 1,409 | 16.3% | |||||
| 198 | Corydon | 1,628.0 | 1,410 | 15.5% | |||||
| 199 | Van Meter | 1,628.0 | 1,199 | 35.8% | |||||
| 200 | Shell Rock | 1,625.0 | 1,335 | 21.7% | |||||
| 201 | Nashua | 1,622.0 | 1,646 | -1.5% | |||||
| 202 | Holstein | 1,600.0 | 1,474 | 8.5% | |||||
| 203 | Panora | 1,579.0 | 1,228 | 28.6% | |||||
| 204 | Lenox | 1,569.0 | 1,315 | 19.3% | |||||
| 205 | Corning | 1,567.0 | 1,674 | -6.4% | |||||
| 206 | Roland | 1,559.0 | 1,349 | 15.6% | |||||
| 207 | Hartley | 1,553.0 | 1,796 | -13.5% | |||||
| 208 | Manning | 1,533.0 | 1,713 | -10.5% | |||||
| 209 | Monona | 1,531.0 | 1,844 | -17.0% | |||||
| 210 | Earlham | 1,528.0 | 1,845 | -17.2% | |||||
| 211 | Traer | 1,519.0 | 1,681 | -9.6% | |||||
| 212 | Dysart | 1,519.0 | 1,520 | -0.1% | |||||
| 213 | Ackley | 1,482.0 | 1,550 | -4.4% | |||||
| 214 | Kingsley | 1,472.0 | 1,317 | 11.8% | |||||
| 215 | Woodbine | 1,471.0 | 1,603 | -8.2% | |||||
| 216 | Coon Rapids | 1,467.0 | 1,181 | 24.2% | |||||
| 217 | Alton | 1,459.0 | 1,077 | 35.5% | |||||
| 218 | Brooklyn | 1,459.0 | 1,322 | 10.4% | |||||
| 219 | Wellman | 1,454.0 | 1,484 | -2.0% | |||||
| 220 | Avoca | 1,444.0 | 1,555 | -7.1% | |||||
| 221 | Palo | 1,438.0 | 912 | 57.7% | |||||
| 222 | State Center | 1,412.0 | 1,436 | -1.7% | |||||
| 223 | Montezuma | 1,410.0 | 1,617 | -12.8% | |||||
| 224 | Oakland | 1,408.0 | 1,626 | -13.4% | |||||
| 225 | Slater | 1,401.0 | 1,583 | -11.5% | |||||
| 226 | Logan | 1,392.0 | 1,571 | -11.4% | |||||
| 227 | University Heights | 1,384.0 | 1,111 | 24.6% | |||||
| 228 | Gilbert | 1,381.0 | 1,054 | 31.0% | |||||
| 229 | Dike | 1,365.0 | 1,095 | 24.7% | |||||
| 230 | Nora Springs | 1,363.0 | 1,557 | -12.5% | |||||
| 231 | Central City | 1,356.0 | 1,250 | 8.5% | |||||
| 232 | Walnut | 1,342.0 | 851 | 57.7% | |||||
| 233 | Greene | 1,339.0 | 1,177 | 13.8% | |||||
| 234 | Bedford | 1,336.0 | 1,651 | -19.1% | |||||
| 235 | Walford | 1,329.0 | 1,519 | -12.5% | |||||
| 236 | Sanborn | 1,323.0 | 1,302 | 1.6% | |||||
| 237 | Malvern | 1,323.0 | 1,158 | 14.2% | |||||
| 238 | Manly | 1,320.0 | 1,181 | 11.8% | |||||
| 239 | Fayette | 1,309.0 | 1,481 | -11.6% | |||||
| 240 | Elkader | 1,293.0 | 1,281 | 0.9% | |||||
| 241 | Fairbank | 1,275.0 | 1,236 | 3.2% | |||||
| 242 | Strawberry Point | 1,267.0 | 1,246 | 1.7% | |||||
| 243 | Baxter | 1,247.0 | 1,153 | 8.2% | |||||
| 244 | Clarksville | 1,237.0 | 1,558 | -20.6% | |||||
| 245 | Lone Tree | 1,218.0 | 1,333 | -8.6% | |||||
| 246 | Laurens | 1,206.0 | 1,402 | -14.0% | |||||
| 247 | St. Ansgar | 1,206.0 | 1,205 | 0.1% | |||||
| 248 | Wayland | 1,191.0 | 903 | 31.9% | |||||
| 249 | Conrad | 1,191.0 | 932 | 27.8% | |||||
| 250 | Lake Park | 1,184.0 | 1,115 | 6.2% | |||||
| 251 | Swisher | 1,182.0 | 862 | 37.1% | |||||
| 252 | Marcus | 1,180.0 | 979 | 20.5% | |||||
| 253 | New Sharon | 1,180.0 | 1,262 | -6.5% | |||||
| 254 | Melcher-Dallas | 1,176.0 | 1,276 | -7.8% | |||||
| 255 | Springville | 1,172.0 | 1,042 | 12.5% | |||||
| 256 | Dunlap | 1,170.0 | 992 | 17.9% | |||||
| 257 | Glidden | 1,169.0 | 1,132 | 3.3% | |||||
| 258 | Clarence | 1,166.0 | 896 | 30.1% | |||||
| 259 | Eddyville | 1,163.0 | 898 | 29.5% | |||||
| 260 | Tripoli | 1,156.0 | 1,301 | -11.1% | |||||
| 261 | Larchwood | 1,136.0 | 900 | 26.2% | |||||
| 262 | Treynor | 1,126.0 | 1,041 | 8.2% | |||||
| 263 | Neola | 1,116.0 | 810 | 37.8% | |||||
| 264 | Lansing | 1,115.0 | 971 | 14.8% | |||||
| 265 | Aplington | 1,111.0 | 1,020 | 8.9% | |||||
| 266 | Buffalo | 1,097.0 | 1,244 | -11.8% | |||||
| 267 | Graettinger | 1,096.0 | 1,027 | 6.7% | |||||
| 268 | Jewell Junction | 1,084.0 | 1,006 | 7.8% | |||||
| 269 | George | 1,064.0 | 1,293 | -17.7% | |||||
| 270 | Sheffield | 1,053.0 | 1,277 | -17.5% | |||||
| 271 | Fruitland | 1,049.0 | 1,349 | -22.2% | |||||
| 272 | Villisca | 1,048.0 | 1,354 | -22.6% | |||||
| 273 | Preston | 1,044.0 | 996 | 4.8% | |||||
| 274 | De Soto | 1,041.0 | 929 | 12.1% | |||||
| 275 | Winthrop | 1,040.0 | 905 | 14.9% | |||||
| 276 | Sully | 1,022.0 | 1,007 | 1.5% | |||||
| 277 | Sloan | 1,018.0 | 1,046 | -2.7% | |||||
| 278 | Primghar | 1,014.0 | 982 | 3.3% | |||||
| 279 | Winfield | 1,007.0 | 1,433 | -29.7% | |||||