Burlington SnackAbility
Overall SnackAbility
Crime in Burlington summary. We use data from the FBI to determine the crime rates in Burlington. Key points include:
There were 525 total crimes in Burlington in the last reporting year.
The overall crime rate per 100,000 people in Burlington is 2,239.4 / 100k people.
The violent crime rate per 100,000 people in Burlington is 413.8 / 100k people.
The property crime rate per 100,000 people in Burlington is 1,825.6 / 100k people.
Overall, crime in Burlington is 5.67% above the national average.
Total Crimes
Above National Average
Crime In Burlington Comparison Table
| Statistic | Count Raw |
Burlington / 100k People |
Iowa / 100k People |
National / 100k People |
|---|---|---|---|---|
| Total Crimes Per 100K | 525 | 2,239.4 | 1,540.0 | 2,119.2 |
| Violent Crime | 97 | 413.8 | 243.3 | 359.0 |
| Murder | 2 | 8.5 | 2.1 | 5.0 |
| Robbery | 4 | 17.1 | 18.7 | 61.0 |
| Aggravated Assault | 82 | 349.8 | 187.2 | 256.0 |
| Property Crime | 428 | 1,825.6 | 1,296.8 | 1,760.0 |
| Burglary | 64 | 273.0 | 199.1 | 229.0 |
| Larceny | 318 | 1,356.4 | 962.6 | 1,272.0 |
| Car Theft | 46 | 196.2 | 135.1 | 259.0 |
Source: FBI Uniform Crime Reporting (2024)
Cost of living in Burlington summary. We use data on the cost of living to determine how expensive it is to live in Burlington. Real estate prices drive most of the variance in cost of living around Iowa. Key points include:
The cost of living in Burlington is 89 with 100 being average.
The cost of living in Burlington is 0.9x lower than the national average.
The median home value in Burlington is $123,914.
The median income in Burlington is $59,000.
Burlington's Overall Cost Of Living
Lower Than The National Average
Cost Of Living In Burlington Comparison Table
| Living Expense | Burlington | Iowa | National Average |
|---|---|---|---|
| Overall | 89 | 90 | 100 |
| Services | 99 | 99 | 100 |
| Groceries | 100 | 95 | 100 |
| Health | 63 | 75 | 100 |
| Housing | 102 | 97 | 100 |
| Transportation | 98 | 93 | 100 |
| Utilities | 95 | 94 | 100 |
Source: Cost of living index, normalized to US average = 100
Burlington, IA Weather
The average high in Burlington is 61.1° and the average low is 41.8°.
There are 67.6 days of precipitation each year.
Expect an average of 38.0 inches of precipitation each year with 22.4 inches of snow.
| Stat | Burlington |
|---|---|
| Average Annual High | 61.1 |
| Average Annual Low | 41.8 |
| Annual Precipitation Days | 67.6 |
| Average Annual Precipitation | 38.0 |
| Average Annual Snowfall | 22.4 |
Average High
Days of Rain
Source: NOAA climate normals (30-year)
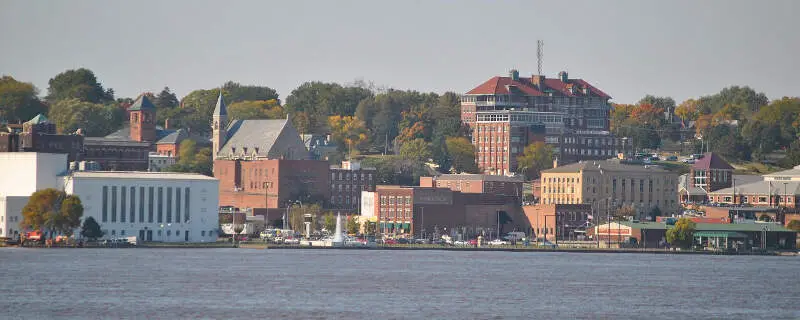
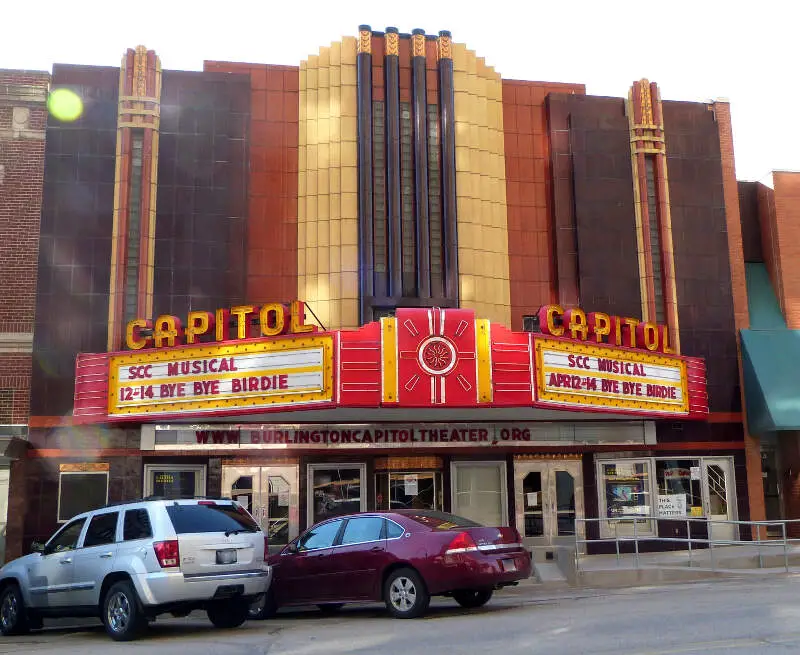
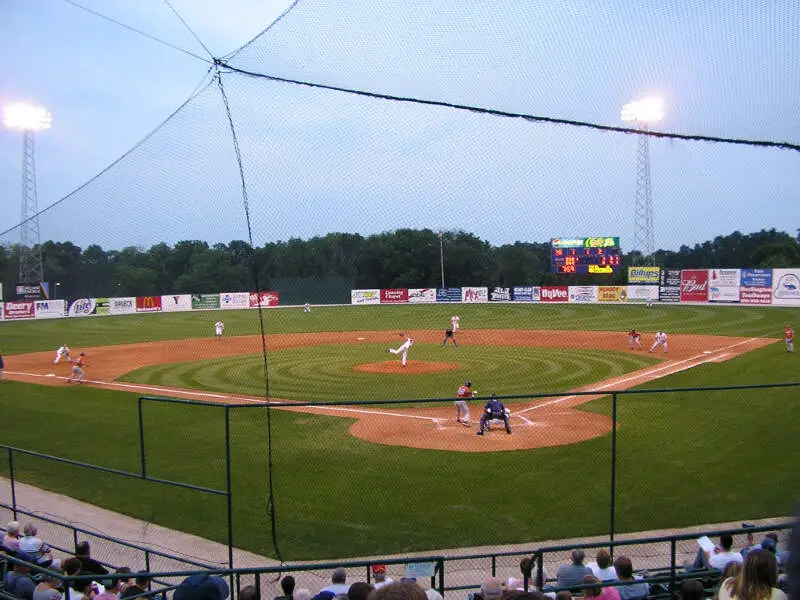
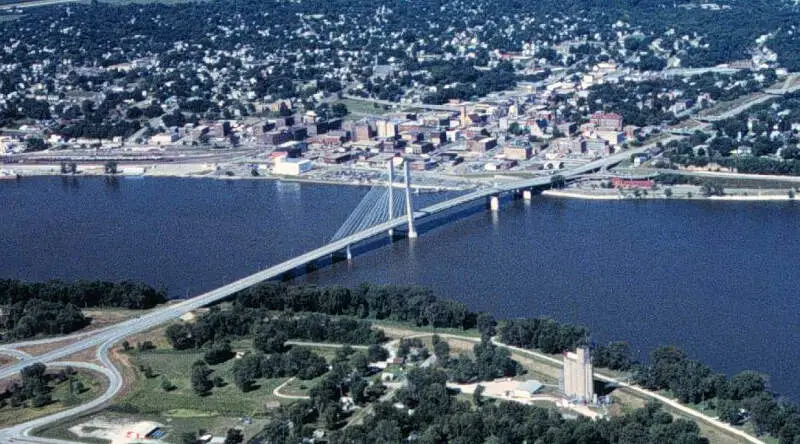
Burlington, IA Photos


1 Reviews & Comments About Burlington

What about Burlington- I lived in Burlington twice, and both times, Burlington was a very closed-minded city when it comes to relating with a person like me.
Rankings & Articles For Burlington


Locations Around Burlington
Map Of Burlington, IA
Best Places Around Burlington
Macomb, IL
Population 14,894
Monmouth, IL
Population 8,581
Washington, IA
Population 7,290
Galesburg, IL
Population 29,481
Fairfield, IA
Population 9,456
Muscatine, IA
Population 23,489
Mount Pleasant, IA
Population 8,951
Fort Madison, IA
Population 10,133
Keokuk, IA
Population 9,662
Burlington Demographics And Statistics
Population over time in Burlington
The current population in Burlington is 23,728. The population has decreased 7.3% from 2010.
| Year | Population | % Change |
|---|---|---|
| 2024 | 23,728 | -0.3% |
| 2023 | 23,800 | -0.7% |
| 2022 | 23,976 | -0.8% |
| 2021 | 24,160 | -2.8% |
| 2020 | 24,858 | -0.5% |
| 2019 | 24,974 | -0.6% |
| 2018 | 25,127 | -0.8% |
| 2017 | 25,330 | -0.6% |
| 2016 | 25,492 | -0.2% |
| 2015 | 25,537 | -0.1% |
| 2014 | 25,559 | -0.2% |
| 2013 | 25,619 | -0.0% |
| 2012 | 25,624 | 0.1% |
| 2011 | 25,603 | -0.0% |
| 2010 | 25,604 | - |
Race / Ethnicity in Burlington
See the full breakdown
Burlington is:
80.9% White with 19,192 White residents.
6.6% African American with 1,573 African American residents.
0.4% American Indian with 88 American Indian residents.
1.5% Asian with 360 Asian residents.
0.0% Hawaiian with 1 Hawaiian residents.
0.3% Other with 67 Other residents.
5.5% Two Or More with 1,313 Two Or More residents.
4.8% Hispanic with 1,134 Hispanic residents.
| Race | Burlington | IA | USA |
|---|---|---|---|
| White | 80.9% | 82.3% | 57.4% |
| African American | 6.6% | 3.8% | 11.9% |
| American Indian | 0.4% | 0.2% | 0.5% |
| Asian | 1.5% | 2.5% | 5.9% |
| Hawaiian | 0.0% | 0.2% | 0.2% |
| Other | 0.3% | 0.3% | 0.6% |
| Two Or More | 5.5% | 3.5% | 4.3% |
| Hispanic | 4.8% | 7.3% | 19.3% |
Gender in Burlington
See the full breakdown
Burlington is 51.3% female with 12,166 female residents.
Burlington is 48.7% male with 11,561 male residents.
| Gender | Burlington | IA | USA |
|---|---|---|---|
| Female | 51.3% | 49.8% | 50.5% |
| Male | 48.7% | 50.2% | 49.5% |
Highest level of educational attainment in Burlington for adults over 25
See the full breakdown
2.0% of adults in Burlington completed < 9th grade.
5.0% of adults in Burlington completed 9-12th grade.
35.0% of adults in Burlington completed high school / ged.
23.0% of adults in Burlington completed some college.
13.0% of adults in Burlington completed associate's degree.
16.0% of adults in Burlington completed bachelor's degree.
4.0% of adults in Burlington completed master's degree.
2.0% of adults in Burlington completed professional degree.
0.0% of adults in Burlington completed doctorate degree.
| Education | Burlington | IA | USA |
|---|---|---|---|
| < 9th Grade | 2.0% | 3.0% | 4.0% |
| 9-12th Grade | 5.0% | 4.0% | 6.0% |
| High School / GED | 35.0% | 30.0% | 26.0% |
| Some College | 23.0% | 20.0% | 19.0% |
| Associate's Degree | 13.0% | 12.0% | 9.0% |
| Bachelor's Degree | 16.0% | 21.0% | 22.0% |
| Master's Degree | 4.0% | 7.0% | 10.0% |
| Professional Degree | 2.0% | 2.0% | 2.0% |
| Doctorate Degree | 0.0% | 1.0% | 2.0% |
Household Income For Burlington, Iowa
See the full breakdown
4.1% of households in Burlington earn Less than $10,000.
5.8% of households in Burlington earn $10,000 to $14,999.
9.5% of households in Burlington earn $15,000 to $24,999.
10.2% of households in Burlington earn $25,000 to $34,999.
12.0% of households in Burlington earn $35,000 to $49,999.
20.2% of households in Burlington earn $50,000 to $74,999.
16.2% of households in Burlington earn $75,000 to $99,999.
12.5% of households in Burlington earn $100,000 to $149,999.
5.3% of households in Burlington earn $150,000 to $199,999.
4.2% of households in Burlington earn $200,000 or more.
| Income | Burlington | IA | USA |
|---|---|---|---|
| Less than $10,000 | 4.1% | 4.0% | 5.0% |
| $10,000 to $14,999 | 5.8% | 3.2% | 3.4% |
| $15,000 to $24,999 | 9.5% | 6.7% | 6.3% |
| $25,000 to $34,999 | 10.2% | 7.2% | 6.6% |
| $35,000 to $49,999 | 12.0% | 11.3% | 10.1% |
| $50,000 to $74,999 | 20.2% | 17.5% | 15.5% |
| $75,000 to $99,999 | 16.2% | 14.0% | 12.6% |
| $100,000 to $149,999 | 12.5% | 18.7% | 17.5% |
| $150,000 to $199,999 | 5.3% | 8.8% | 9.6% |
| $200,000 or more | 4.2% | 8.6% | 13.4% |
Source: U.S. Census ACS 5-year estimates (2024)


