Creston SnackAbility
Overall SnackAbility
Crime in Creston summary. We use data from the FBI to determine the crime rates in Creston. Key points include:
There were 96 total crimes in Creston in the last reporting year.
The overall crime rate per 100,000 people in Creston is 1,307.0 / 100k people.
The violent crime rate per 100,000 people in Creston is 272.3 / 100k people.
The property crime rate per 100,000 people in Creston is 1,034.7 / 100k people.
Overall, crime in Creston is -38.33% below the national average.
Total Crimes
Below National Average
Crime In Creston Comparison Table
| Statistic | Count Raw |
Creston / 100k People |
Iowa / 100k People |
National / 100k People |
|---|---|---|---|---|
| Total Crimes Per 100K | 96 | 1,307.0 | 1,540.0 | 2,119.2 |
| Violent Crime | 20 | 272.3 | 243.3 | 359.0 |
| Murder | 0 | 0.0 | 2.1 | 5.0 |
| Robbery | 1 | 13.6 | 18.7 | 61.0 |
| Aggravated Assault | 14 | 190.6 | 187.2 | 256.0 |
| Property Crime | 76 | 1,034.7 | 1,296.8 | 1,760.0 |
| Burglary | 13 | 177.0 | 199.1 | 229.0 |
| Larceny | 54 | 735.2 | 962.6 | 1,272.0 |
| Car Theft | 9 | 122.5 | 135.1 | 259.0 |
Source: FBI Uniform Crime Reporting (2024)
Cost of living in Creston summary. We use data on the cost of living to determine how expensive it is to live in Creston. Real estate prices drive most of the variance in cost of living around Iowa. Key points include:
The cost of living in Creston is 85 with 100 being average.
The cost of living in Creston is 0.8x lower than the national average.
The median home value in Creston is $152,978.
The median income in Creston is $52,633.
Creston's Overall Cost Of Living
Lower Than The National Average
Cost Of Living In Creston Comparison Table
| Living Expense | Creston | Iowa | National Average |
|---|---|---|---|
| Overall | 85 | 90 | 100 |
| Services | 100 | 99 | 100 |
| Groceries | 99 | 95 | 100 |
| Health | 59 | 75 | 100 |
| Housing | 96 | 97 | 100 |
| Transportation | 96 | 93 | 100 |
| Utilities | 91 | 94 | 100 |
Source: Cost of living index, normalized to US average = 100
Creston, IA Weather
The average high in Creston is 60.6° and the average low is 39.8°.
There are 60.6 days of precipitation each year.
Expect an average of 34.3 inches of precipitation each year with 26.9 inches of snow.
| Stat | Creston |
|---|---|
| Average Annual High | 60.6 |
| Average Annual Low | 39.8 |
| Annual Precipitation Days | 60.6 |
| Average Annual Precipitation | 34.3 |
| Average Annual Snowfall | 26.9 |
Average High
Days of Rain
Source: NOAA climate normals (30-year)
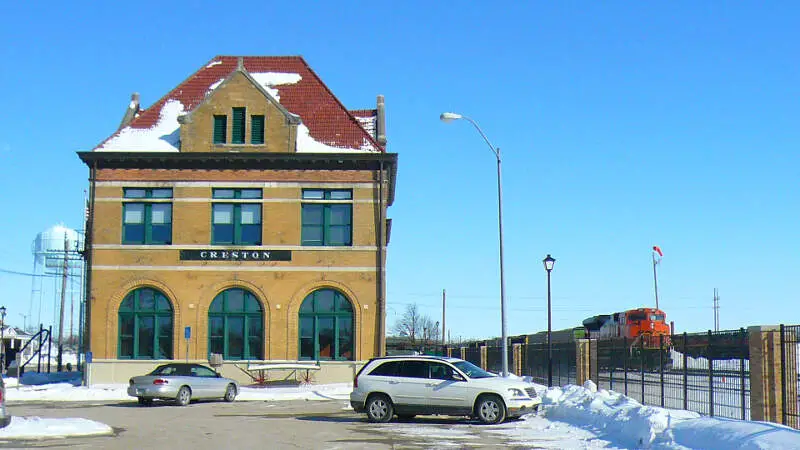
Creston, IA Photos
Rankings & Articles For Creston


Locations Around Creston
Map Of Creston, IA
Best Places Around Creston
Clive, IA
Population 19,012
West Des Moines, IA
Population 71,083
Norwalk, IA
Population 14,183
Waukee, IA
Population 29,236
Indianola, IA
Population 16,044
Winterset, IA
Population 5,416
Atlantic, IA
Population 6,763
Red Oak, IA
Population 5,510
Decatur, IL
Population 69,815
Creston Demographics And Statistics
Population over time in Creston
The current population in Creston is 7,435. The population has decreased 3.9% from 2010.
| Year | Population | % Change |
|---|---|---|
| 2024 | 7,435 | -0.4% |
| 2023 | 7,466 | -0.7% |
| 2022 | 7,519 | -1.0% |
| 2021 | 7,594 | -2.1% |
| 2020 | 7,754 | -0.4% |
| 2019 | 7,784 | -0.6% |
| 2018 | 7,832 | -0.4% |
| 2017 | 7,860 | -0.2% |
| 2016 | 7,877 | -0.1% |
| 2015 | 7,886 | 0.5% |
| 2014 | 7,846 | -0.0% |
| 2013 | 7,847 | 0.3% |
| 2012 | 7,821 | 0.4% |
| 2011 | 7,788 | 0.6% |
| 2010 | 7,738 | - |
Race / Ethnicity in Creston
See the full breakdown
Creston is:
92.2% White with 6,854 White residents.
0.9% African American with 68 African American residents.
0.0% American Indian with 0 American Indian residents.
1.2% Asian with 86 Asian residents.
0.0% Hawaiian with 0 Hawaiian residents.
0.1% Other with 9 Other residents.
2.0% Two Or More with 146 Two Or More residents.
3.7% Hispanic with 272 Hispanic residents.
| Race | Creston | IA | USA |
|---|---|---|---|
| White | 92.2% | 82.3% | 57.4% |
| African American | 0.9% | 3.8% | 11.9% |
| American Indian | 0.0% | 0.2% | 0.5% |
| Asian | 1.2% | 2.5% | 5.9% |
| Hawaiian | 0.0% | 0.2% | 0.2% |
| Other | 0.1% | 0.3% | 0.6% |
| Two Or More | 2.0% | 3.5% | 4.3% |
| Hispanic | 3.7% | 7.3% | 19.3% |
Gender in Creston
See the full breakdown
Creston is 50.6% female with 3,760 female residents.
Creston is 49.4% male with 3,675 male residents.
| Gender | Creston | IA | USA |
|---|---|---|---|
| Female | 50.6% | 49.8% | 50.5% |
| Male | 49.4% | 50.2% | 49.5% |
Highest level of educational attainment in Creston for adults over 25
See the full breakdown
1.0% of adults in Creston completed < 9th grade.
7.0% of adults in Creston completed 9-12th grade.
35.0% of adults in Creston completed high school / ged.
25.0% of adults in Creston completed some college.
8.0% of adults in Creston completed associate's degree.
17.0% of adults in Creston completed bachelor's degree.
6.0% of adults in Creston completed master's degree.
1.0% of adults in Creston completed professional degree.
0.0% of adults in Creston completed doctorate degree.
| Education | Creston | IA | USA |
|---|---|---|---|
| < 9th Grade | 1.0% | 3.0% | 4.0% |
| 9-12th Grade | 7.0% | 4.0% | 6.0% |
| High School / GED | 35.0% | 30.0% | 26.0% |
| Some College | 25.0% | 20.0% | 19.0% |
| Associate's Degree | 8.0% | 12.0% | 9.0% |
| Bachelor's Degree | 17.0% | 21.0% | 22.0% |
| Master's Degree | 6.0% | 7.0% | 10.0% |
| Professional Degree | 1.0% | 2.0% | 2.0% |
| Doctorate Degree | 0.0% | 1.0% | 2.0% |
Household Income For Creston, Iowa
See the full breakdown
7.9% of households in Creston earn Less than $10,000.
4.4% of households in Creston earn $10,000 to $14,999.
8.5% of households in Creston earn $15,000 to $24,999.
11.3% of households in Creston earn $25,000 to $34,999.
15.4% of households in Creston earn $35,000 to $49,999.
19.5% of households in Creston earn $50,000 to $74,999.
18.6% of households in Creston earn $75,000 to $99,999.
8.5% of households in Creston earn $100,000 to $149,999.
4.4% of households in Creston earn $150,000 to $199,999.
1.4% of households in Creston earn $200,000 or more.
| Income | Creston | IA | USA |
|---|---|---|---|
| Less than $10,000 | 7.9% | 4.0% | 5.0% |
| $10,000 to $14,999 | 4.4% | 3.2% | 3.4% |
| $15,000 to $24,999 | 8.5% | 6.7% | 6.3% |
| $25,000 to $34,999 | 11.3% | 7.2% | 6.6% |
| $35,000 to $49,999 | 15.4% | 11.3% | 10.1% |
| $50,000 to $74,999 | 19.5% | 17.5% | 15.5% |
| $75,000 to $99,999 | 18.6% | 14.0% | 12.6% |
| $100,000 to $149,999 | 8.5% | 18.7% | 17.5% |
| $150,000 to $199,999 | 4.4% | 8.8% | 9.6% |
| $200,000 or more | 1.4% | 8.6% | 13.4% |
Source: U.S. Census ACS 5-year estimates (2024)


