Marshalltown SnackAbility
Overall SnackAbility
Crime in Marshalltown summary. We use data from the FBI to determine the crime rates in Marshalltown. Key points include:
There were 571 total crimes in Marshalltown in the last reporting year.
The overall crime rate per 100,000 people in Marshalltown is 2,070.6 / 100k people.
The violent crime rate per 100,000 people in Marshalltown is 297.4 / 100k people.
The property crime rate per 100,000 people in Marshalltown is 1,773.3 / 100k people.
Overall, crime in Marshalltown is -2.29% below the national average.
Total Crimes
Below National Average
Crime In Marshalltown Comparison Table
| Statistic | Count Raw |
Marshalltown / 100k People |
Iowa / 100k People |
National / 100k People |
|---|---|---|---|---|
| Total Crimes Per 100K | 571 | 2,070.6 | 1,540.0 | 2,119.2 |
| Violent Crime | 82 | 297.4 | 243.3 | 359.0 |
| Murder | 2 | 7.3 | 2.1 | 5.0 |
| Robbery | 4 | 14.5 | 18.7 | 61.0 |
| Aggravated Assault | 64 | 232.1 | 187.2 | 256.0 |
| Property Crime | 489 | 1,773.3 | 1,296.8 | 1,760.0 |
| Burglary | 83 | 301.0 | 199.1 | 229.0 |
| Larceny | 377 | 1,367.1 | 962.6 | 1,272.0 |
| Car Theft | 29 | 105.2 | 135.1 | 259.0 |
Source: FBI Uniform Crime Reporting (2024)
Cost of living in Marshalltown summary. We use data on the cost of living to determine how expensive it is to live in Marshalltown. Real estate prices drive most of the variance in cost of living around Iowa. Key points include:
The cost of living in Marshalltown is 83 with 100 being average.
The cost of living in Marshalltown is 0.8x lower than the national average.
The median home value in Marshalltown is $173,581.
The median income in Marshalltown is $69,068.
Marshalltown's Overall Cost Of Living
Lower Than The National Average
Cost Of Living In Marshalltown Comparison Table
| Living Expense | Marshalltown | Iowa | National Average |
|---|---|---|---|
| Overall | 83 | 90 | 100 |
| Services | 96 | 99 | 100 |
| Groceries | 96 | 95 | 100 |
| Health | 61 | 75 | 100 |
| Housing | 97 | 97 | 100 |
| Transportation | 93 | 93 | 100 |
| Utilities | 94 | 94 | 100 |
Source: Cost of living index, normalized to US average = 100
Marshalltown, IA Weather
The average high in Marshalltown is 58.3° and the average low is 37.7°.
There are 67.0 days of precipitation each year.
Expect an average of 36.6 inches of precipitation each year with 26.3 inches of snow.
| Stat | Marshalltown |
|---|---|
| Average Annual High | 58.3 |
| Average Annual Low | 37.7 |
| Annual Precipitation Days | 67.0 |
| Average Annual Precipitation | 36.6 |
| Average Annual Snowfall | 26.3 |
Average High
Days of Rain
Source: NOAA climate normals (30-year)
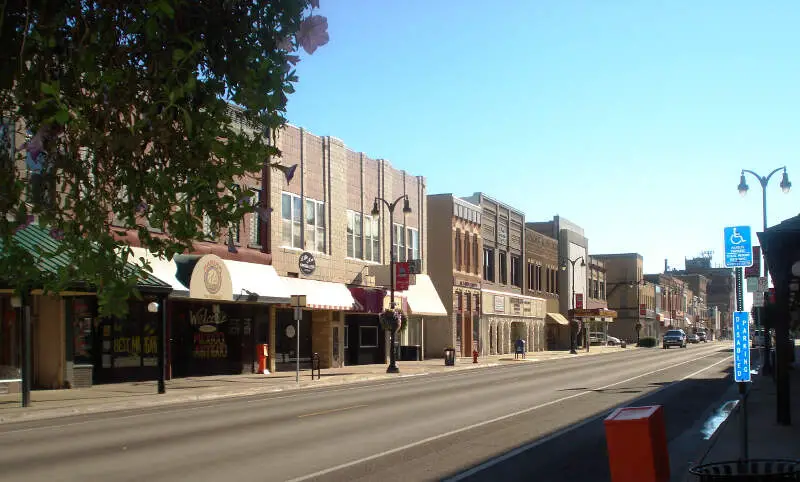
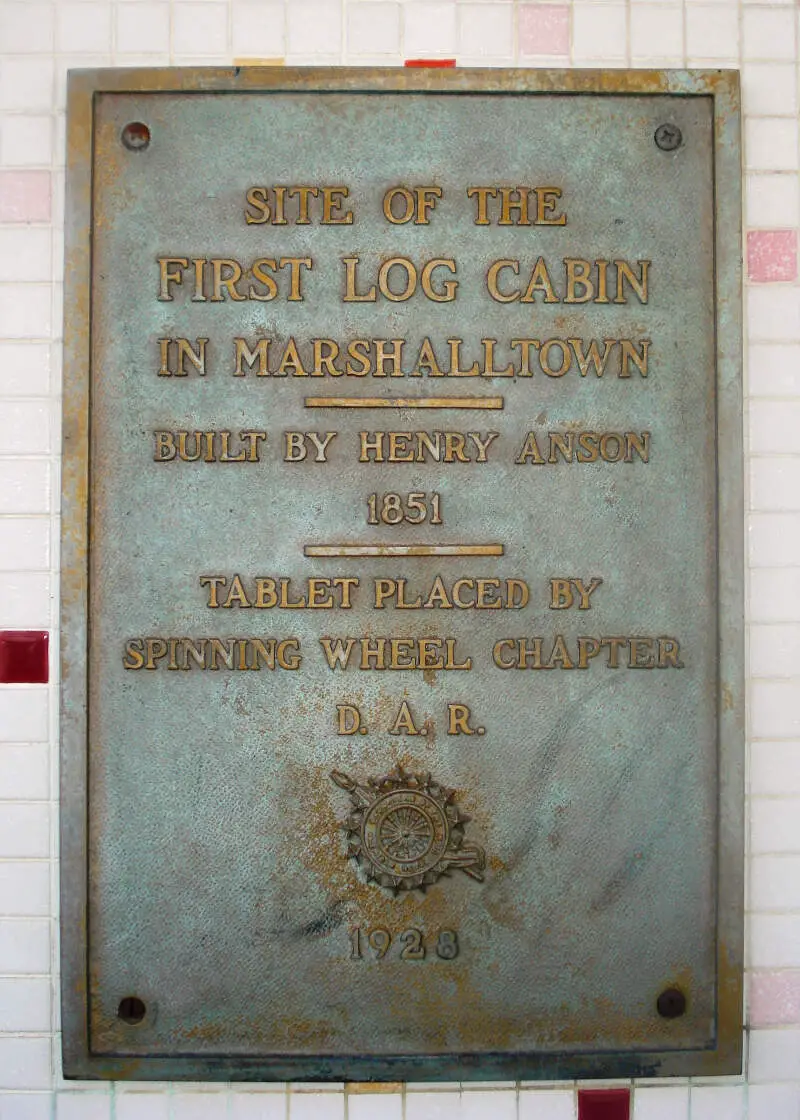
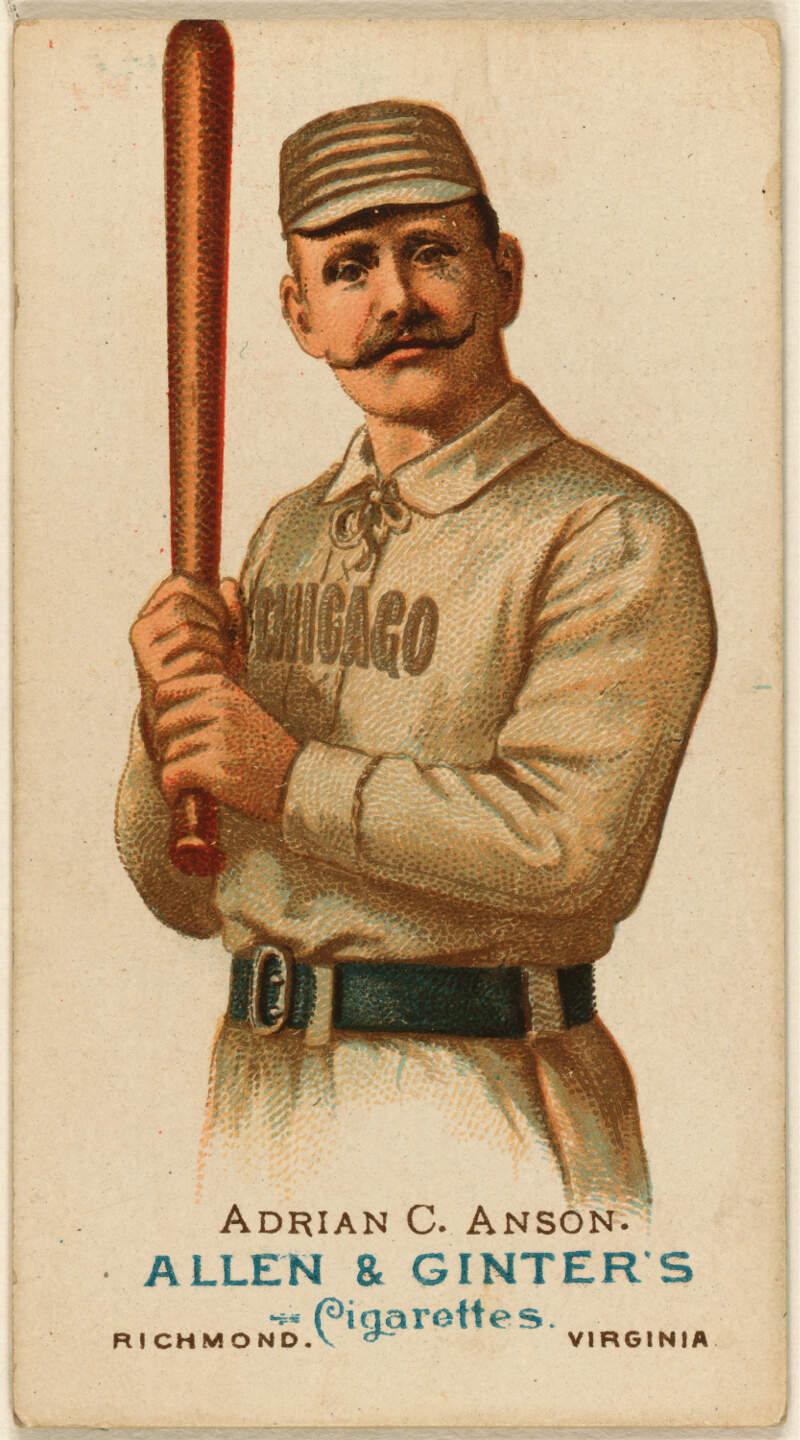
Marshalltown, IA Photos
Rankings & Articles For Marshalltown


Locations Around Marshalltown
Map Of Marshalltown, IA
Best Places Around Marshalltown
Ankeny, IA
Population 72,615
Johnston, IA
Population 24,384
Cedar Falls, IA
Population 40,888
Ames, IA
Population 67,669
Altoona, IA
Population 21,495
Pleasant Hill, IA
Population 11,136
Nevada, IA
Population 6,983
Boone, IA
Population 12,424
Pella, IA
Population 10,720
Des Moines, IA
Population 212,421
Marshalltown Demographics And Statistics
Population over time in Marshalltown
The current population in Marshalltown is 27,626. The population has increased 2.0% from 2010.
| Year | Population | % Change |
|---|---|---|
| 2024 | 27,626 | 0.5% |
| 2023 | 27,491 | -0.1% |
| 2022 | 27,511 | -0.2% |
| 2021 | 27,570 | 2.3% |
| 2020 | 26,957 | -0.4% |
| 2019 | 27,053 | -0.8% |
| 2018 | 27,275 | -0.6% |
| 2017 | 27,440 | -0.7% |
| 2016 | 27,637 | -0.5% |
| 2015 | 27,770 | 0.1% |
| 2014 | 27,749 | 0.3% |
| 2013 | 27,656 | 0.7% |
| 2012 | 27,465 | 0.6% |
| 2011 | 27,309 | 0.8% |
| 2010 | 27,096 | - |
Race / Ethnicity in Marshalltown
See the full breakdown
Marshalltown is:
54.1% White with 14,935 White residents.
2.1% African American with 586 African American residents.
0.3% American Indian with 87 American Indian residents.
4.9% Asian with 1,343 Asian residents.
0.0% Hawaiian with 0 Hawaiian residents.
0.5% Other with 133 Other residents.
4.0% Two Or More with 1,099 Two Or More residents.
34.2% Hispanic with 9,443 Hispanic residents.
| Race | Marshalltown | IA | USA |
|---|---|---|---|
| White | 54.1% | 82.3% | 57.4% |
| African American | 2.1% | 3.8% | 11.9% |
| American Indian | 0.3% | 0.2% | 0.5% |
| Asian | 4.9% | 2.5% | 5.9% |
| Hawaiian | 0.0% | 0.2% | 0.2% |
| Other | 0.5% | 0.3% | 0.6% |
| Two Or More | 4.0% | 3.5% | 4.3% |
| Hispanic | 34.2% | 7.3% | 19.3% |
Gender in Marshalltown
See the full breakdown
Marshalltown is 49.3% female with 13,620 female residents.
Marshalltown is 50.7% male with 14,005 male residents.
| Gender | Marshalltown | IA | USA |
|---|---|---|---|
| Female | 49.3% | 49.8% | 50.5% |
| Male | 50.7% | 50.2% | 49.5% |
Highest level of educational attainment in Marshalltown for adults over 25
See the full breakdown
13.0% of adults in Marshalltown completed < 9th grade.
7.0% of adults in Marshalltown completed 9-12th grade.
31.0% of adults in Marshalltown completed high school / ged.
19.0% of adults in Marshalltown completed some college.
10.0% of adults in Marshalltown completed associate's degree.
13.0% of adults in Marshalltown completed bachelor's degree.
6.0% of adults in Marshalltown completed master's degree.
1.0% of adults in Marshalltown completed professional degree.
0.0% of adults in Marshalltown completed doctorate degree.
| Education | Marshalltown | IA | USA |
|---|---|---|---|
| < 9th Grade | 13.0% | 3.0% | 4.0% |
| 9-12th Grade | 7.0% | 4.0% | 6.0% |
| High School / GED | 31.0% | 30.0% | 26.0% |
| Some College | 19.0% | 20.0% | 19.0% |
| Associate's Degree | 10.0% | 12.0% | 9.0% |
| Bachelor's Degree | 13.0% | 21.0% | 22.0% |
| Master's Degree | 6.0% | 7.0% | 10.0% |
| Professional Degree | 1.0% | 2.0% | 2.0% |
| Doctorate Degree | 0.0% | 1.0% | 2.0% |
Household Income For Marshalltown, Iowa
See the full breakdown
4.5% of households in Marshalltown earn Less than $10,000.
4.0% of households in Marshalltown earn $10,000 to $14,999.
6.3% of households in Marshalltown earn $15,000 to $24,999.
9.5% of households in Marshalltown earn $25,000 to $34,999.
11.0% of households in Marshalltown earn $35,000 to $49,999.
19.4% of households in Marshalltown earn $50,000 to $74,999.
18.5% of households in Marshalltown earn $75,000 to $99,999.
17.0% of households in Marshalltown earn $100,000 to $149,999.
5.6% of households in Marshalltown earn $150,000 to $199,999.
4.2% of households in Marshalltown earn $200,000 or more.
| Income | Marshalltown | IA | USA |
|---|---|---|---|
| Less than $10,000 | 4.5% | 4.0% | 5.0% |
| $10,000 to $14,999 | 4.0% | 3.2% | 3.4% |
| $15,000 to $24,999 | 6.3% | 6.7% | 6.3% |
| $25,000 to $34,999 | 9.5% | 7.2% | 6.6% |
| $35,000 to $49,999 | 11.0% | 11.3% | 10.1% |
| $50,000 to $74,999 | 19.4% | 17.5% | 15.5% |
| $75,000 to $99,999 | 18.5% | 14.0% | 12.6% |
| $100,000 to $149,999 | 17.0% | 18.7% | 17.5% |
| $150,000 to $199,999 | 5.6% | 8.8% | 9.6% |
| $200,000 or more | 4.2% | 8.6% | 13.4% |
Source: U.S. Census ACS 5-year estimates (2024)


