Ammon SnackAbility
Overall SnackAbility
Cost of living in Ammon summary. We use data on the cost of living to determine how expensive it is to live in Ammon. Real estate prices drive most of the variance in cost of living around Idaho. Key points include:
The cost of living in Ammon is 106 with 100 being average.
The cost of living in Ammon is 1.1x higher than the national average.
The median home value in Ammon is $416,579.
The median income in Ammon is $86,121.
Ammon's Overall Cost Of Living
Higher Than The National Average
Cost Of Living In Ammon Comparison Table
| Living Expense | Ammon | Idaho | National Average |
|---|---|---|---|
| Overall | 106 | 100 | 100 |
| Services | 105 | 100 | 100 |
| Groceries | 100 | 101 | 100 |
| Health | 112 | 89 | 100 |
| Housing | 104 | 104 | 100 |
| Transportation | 104 | 103 | 100 |
| Utilities | 104 | 107 | 100 |
Source: Cost of living index, normalized to US average = 100
Ammon, ID Weather
The average high in Ammon is 57.5° and the average low is 31.0°.
There are 43.8 days of precipitation each year.
Expect an average of 13.0 inches of precipitation each year with 49.5 inches of snow.
| Stat | Ammon |
|---|---|
| Average Annual High | 57.5 |
| Average Annual Low | 31.0 |
| Annual Precipitation Days | 43.8 |
| Average Annual Precipitation | 13.0 |
| Average Annual Snowfall | 49.5 |
Average High
Days of Rain
Source: NOAA climate normals (30-year)
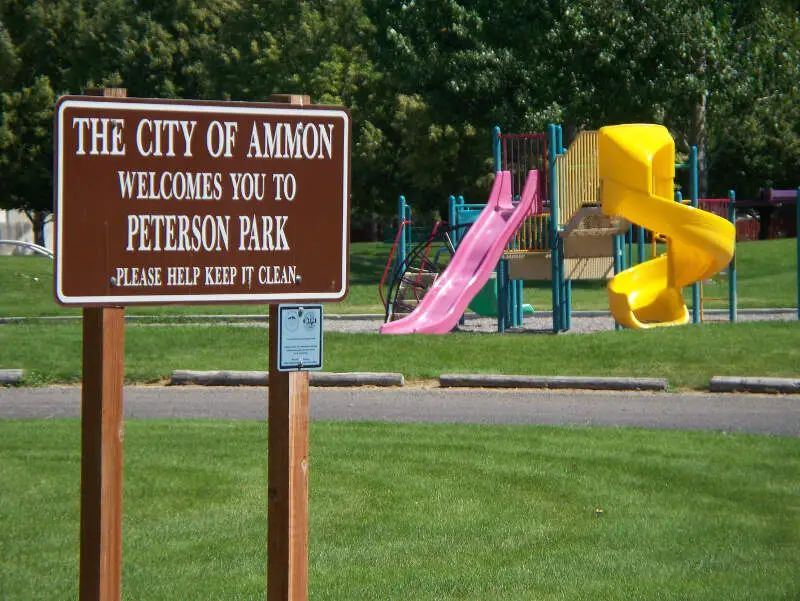
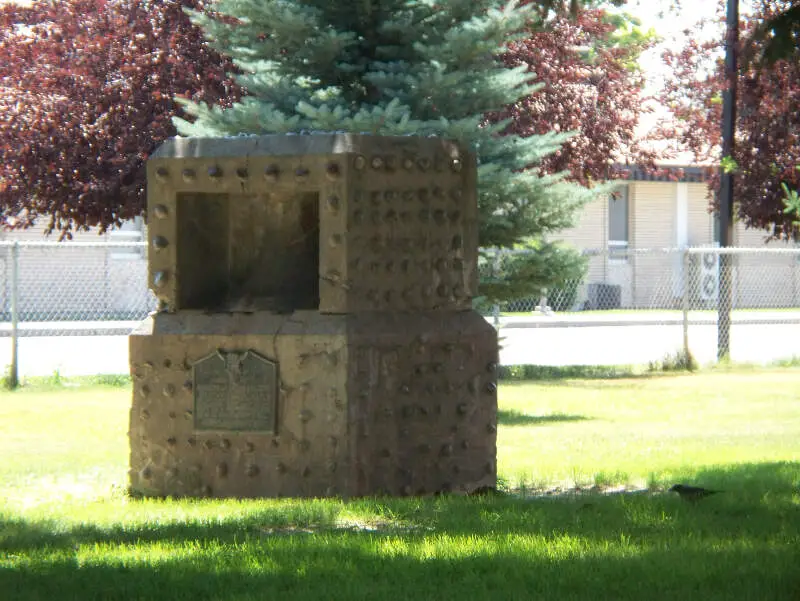
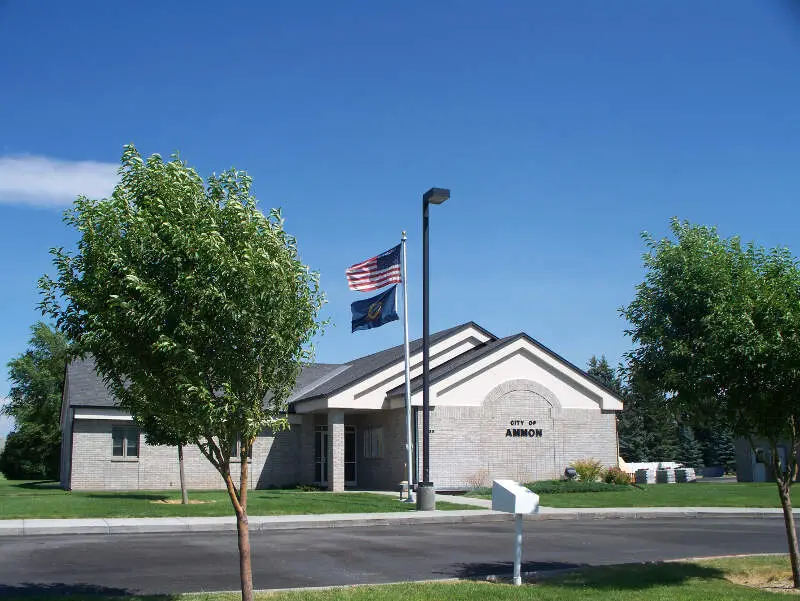
Ammon, ID Photos
Rankings & Articles For Ammon


Locations Around Ammon
Map Of Ammon, ID
Best Places Around Ammon
Shelley, ID
Population 5,092
Rexburg, ID
Population 40,543
Chubbuck, ID
Population 16,126
Blackfoot, ID
Population 12,782
Idaho Falls, ID
Population 67,725
Pocatello, ID
Population 57,635
Ammon Demographics And Statistics
Population over time in Ammon
The current population in Ammon is 19,064. The population has increased 53.2% from 2010.
| Year | Population | % Change |
|---|---|---|
| 2024 | 19,064 | 3.1% |
| 2023 | 18,496 | 3.2% |
| 2022 | 17,921 | 3.0% |
| 2021 | 17,401 | 6.1% |
| 2020 | 16,403 | 3.4% |
| 2019 | 15,859 | 3.0% |
| 2018 | 15,403 | 2.7% |
| 2017 | 14,998 | 1.6% |
| 2016 | 14,767 | 2.1% |
| 2015 | 14,469 | 1.5% |
| 2014 | 14,257 | 1.9% |
| 2013 | 13,993 | 3.1% |
| 2012 | 13,575 | 3.8% |
| 2011 | 13,084 | 5.2% |
| 2010 | 12,443 | - |
Race / Ethnicity in Ammon
See the full breakdown
Ammon is:
84.3% White with 16,062 White residents.
0.1% African American with 17 African American residents.
0.1% American Indian with 24 American Indian residents.
1.2% Asian with 232 Asian residents.
0.0% Hawaiian with 0 Hawaiian residents.
0.5% Other with 98 Other residents.
2.2% Two Or More with 426 Two Or More residents.
11.6% Hispanic with 2,205 Hispanic residents.
| Race | Ammon | ID | USA |
|---|---|---|---|
| White | 84.3% | 78.6% | 57.4% |
| African American | 0.1% | 0.7% | 11.9% |
| American Indian | 0.1% | 0.7% | 0.5% |
| Asian | 1.2% | 1.3% | 5.9% |
| Hawaiian | 0.0% | 0.1% | 0.2% |
| Other | 0.5% | 0.6% | 0.6% |
| Two Or More | 2.2% | 4.2% | 4.3% |
| Hispanic | 11.6% | 13.6% | 19.3% |
Gender in Ammon
See the full breakdown
Ammon is 51.0% female with 9,726 female residents.
Ammon is 49.0% male with 9,338 male residents.
| Gender | Ammon | ID | USA |
|---|---|---|---|
| Female | 51.0% | 49.7% | 50.5% |
| Male | 49.0% | 50.3% | 49.5% |
Highest level of educational attainment in Ammon for adults over 25
See the full breakdown
2.0% of adults in Ammon completed < 9th grade.
2.0% of adults in Ammon completed 9-12th grade.
17.0% of adults in Ammon completed high school / ged.
24.0% of adults in Ammon completed some college.
12.0% of adults in Ammon completed associate's degree.
29.0% of adults in Ammon completed bachelor's degree.
9.0% of adults in Ammon completed master's degree.
3.0% of adults in Ammon completed professional degree.
2.0% of adults in Ammon completed doctorate degree.
| Education | Ammon | ID | USA |
|---|---|---|---|
| < 9th Grade | 2.0% | 4.0% | 4.0% |
| 9-12th Grade | 2.0% | 5.0% | 6.0% |
| High School / GED | 17.0% | 26.0% | 26.0% |
| Some College | 24.0% | 24.0% | 19.0% |
| Associate's Degree | 12.0% | 10.0% | 9.0% |
| Bachelor's Degree | 29.0% | 21.0% | 22.0% |
| Master's Degree | 9.0% | 7.0% | 10.0% |
| Professional Degree | 3.0% | 2.0% | 2.0% |
| Doctorate Degree | 2.0% | 1.0% | 2.0% |
Household Income For Ammon, Idaho
See the full breakdown
0.9% of households in Ammon earn Less than $10,000.
1.7% of households in Ammon earn $10,000 to $14,999.
8.6% of households in Ammon earn $15,000 to $24,999.
4.5% of households in Ammon earn $25,000 to $34,999.
8.6% of households in Ammon earn $35,000 to $49,999.
20.3% of households in Ammon earn $50,000 to $74,999.
13.8% of households in Ammon earn $75,000 to $99,999.
20.0% of households in Ammon earn $100,000 to $149,999.
9.0% of households in Ammon earn $150,000 to $199,999.
12.5% of households in Ammon earn $200,000 or more.
| Income | Ammon | ID | USA |
|---|---|---|---|
| Less than $10,000 | 0.9% | 3.6% | 5.0% |
| $10,000 to $14,999 | 1.7% | 2.7% | 3.4% |
| $15,000 to $24,999 | 8.6% | 6.1% | 6.3% |
| $25,000 to $34,999 | 4.5% | 6.6% | 6.6% |
| $35,000 to $49,999 | 8.6% | 11.0% | 10.1% |
| $50,000 to $74,999 | 20.3% | 18.1% | 15.5% |
| $75,000 to $99,999 | 13.8% | 14.7% | 12.6% |
| $100,000 to $149,999 | 20.0% | 19.3% | 17.5% |
| $150,000 to $199,999 | 9.0% | 8.7% | 9.6% |
| $200,000 or more | 12.5% | 9.2% | 13.4% |
Source: U.S. Census ACS 5-year estimates (2024)


