Idaho Falls SnackAbility
Overall SnackAbility
Crime in Idaho Falls summary. We use data from the FBI to determine the crime rates in Idaho Falls. Key points include:
There were 1,076 total crimes in Idaho Falls in the last reporting year.
The overall crime rate per 100,000 people in Idaho Falls is 1,565.9 / 100k people.
The violent crime rate per 100,000 people in Idaho Falls is 356.5 / 100k people.
The property crime rate per 100,000 people in Idaho Falls is 1,209.3 / 100k people.
Overall, crime in Idaho Falls is -26.11% below the national average.
Total Crimes
Below National Average
Crime In Idaho Falls Comparison Table
| Statistic | Count Raw |
Idaho Falls / 100k People |
Idaho / 100k People |
National / 100k People |
|---|---|---|---|---|
| Total Crimes Per 100K | 1,076 | 1,565.9 | 966.9 | 2,119.2 |
| Violent Crime | 245 | 356.5 | 230.6 | 359.0 |
| Murder | 3 | 4.4 | 1.6 | 5.0 |
| Robbery | 7 | 10.2 | 7.0 | 61.0 |
| Aggravated Assault | 186 | 270.7 | 177.3 | 256.0 |
| Property Crime | 831 | 1,209.3 | 736.3 | 1,760.0 |
| Burglary | 212 | 308.5 | 116.2 | 229.0 |
| Larceny | 532 | 774.2 | 552.6 | 1,272.0 |
| Car Theft | 87 | 126.6 | 67.4 | 259.0 |
Source: FBI Uniform Crime Reporting (2024)
Cost of living in Idaho Falls summary. We use data on the cost of living to determine how expensive it is to live in Idaho Falls. Real estate prices drive most of the variance in cost of living around Idaho. Key points include:
The cost of living in Idaho Falls is 97 with 100 being average.
The cost of living in Idaho Falls is 1.0x lower than the national average.
The median home value in Idaho Falls is $395,034.
The median income in Idaho Falls is $73,110.
Idaho Falls's Overall Cost Of Living
Lower Than The National Average
Cost Of Living In Idaho Falls Comparison Table
| Living Expense | Idaho Falls | Idaho | National Average |
|---|---|---|---|
| Overall | 97 | 100 | 100 |
| Services | 102 | 100 | 100 |
| Groceries | 99 | 101 | 100 |
| Health | 96 | 89 | 100 |
| Housing | 103 | 104 | 100 |
| Transportation | 102 | 103 | 100 |
| Utilities | 102 | 107 | 100 |
Source: Cost of living index, normalized to US average = 100
Idaho Falls, ID Weather
The average high in Idaho Falls is 57.4° and the average low is 30.9°.
There are 39.9 days of precipitation each year.
Expect an average of 12.3 inches of precipitation each year with 43.8 inches of snow.
| Stat | Idaho Falls |
|---|---|
| Average Annual High | 57.4 |
| Average Annual Low | 30.9 |
| Annual Precipitation Days | 39.9 |
| Average Annual Precipitation | 12.3 |
| Average Annual Snowfall | 43.8 |
Average High
Days of Rain
Source: NOAA climate normals (30-year)
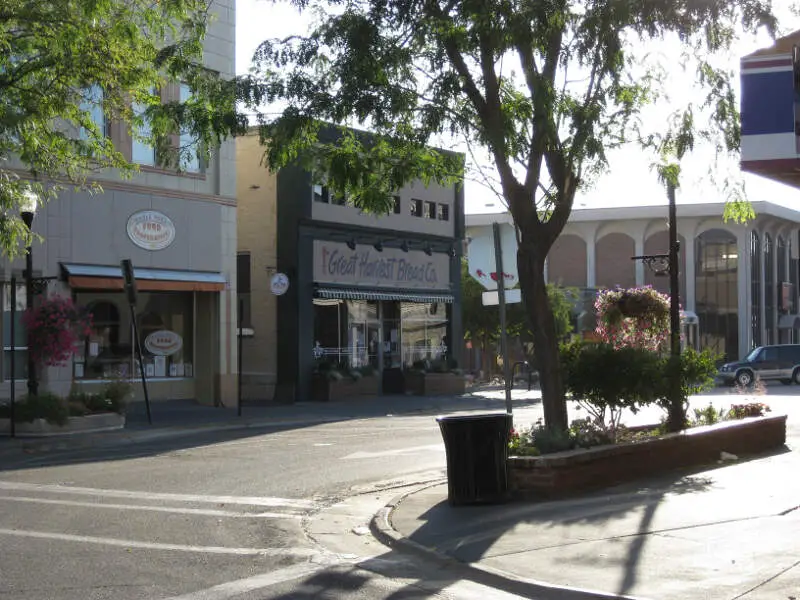
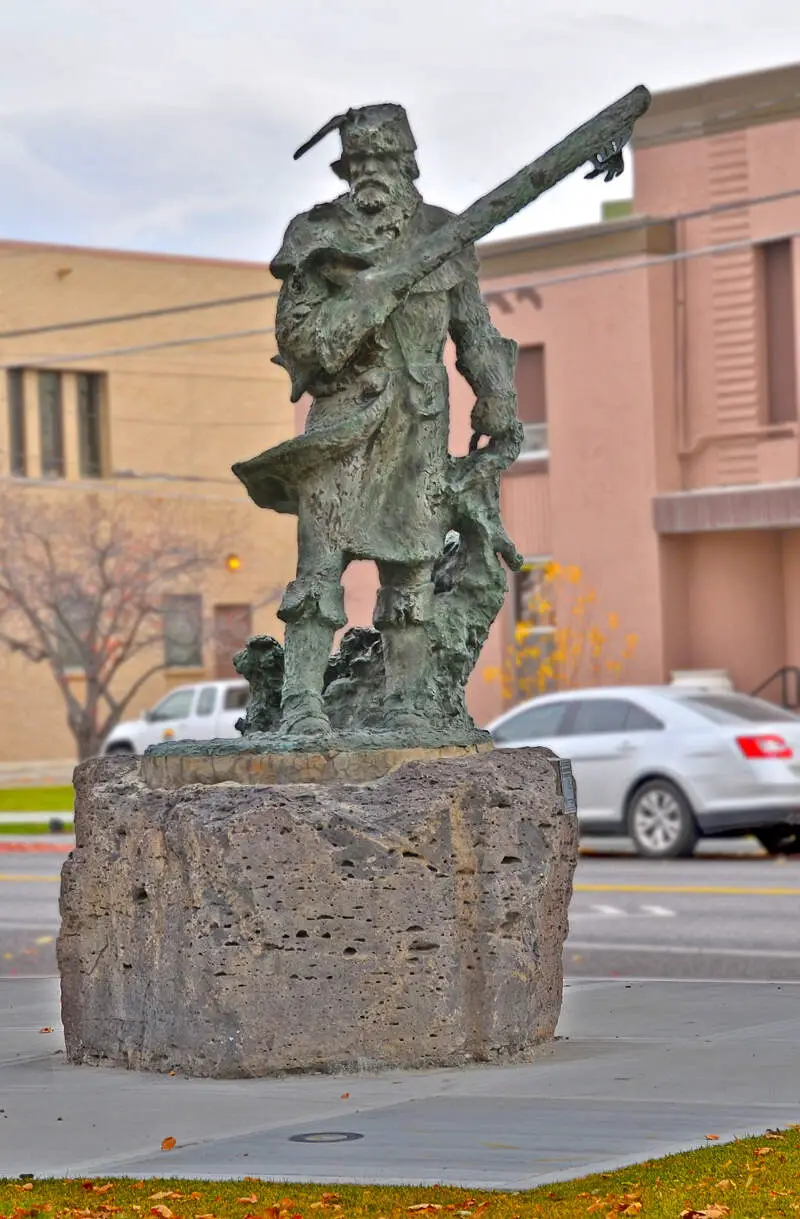
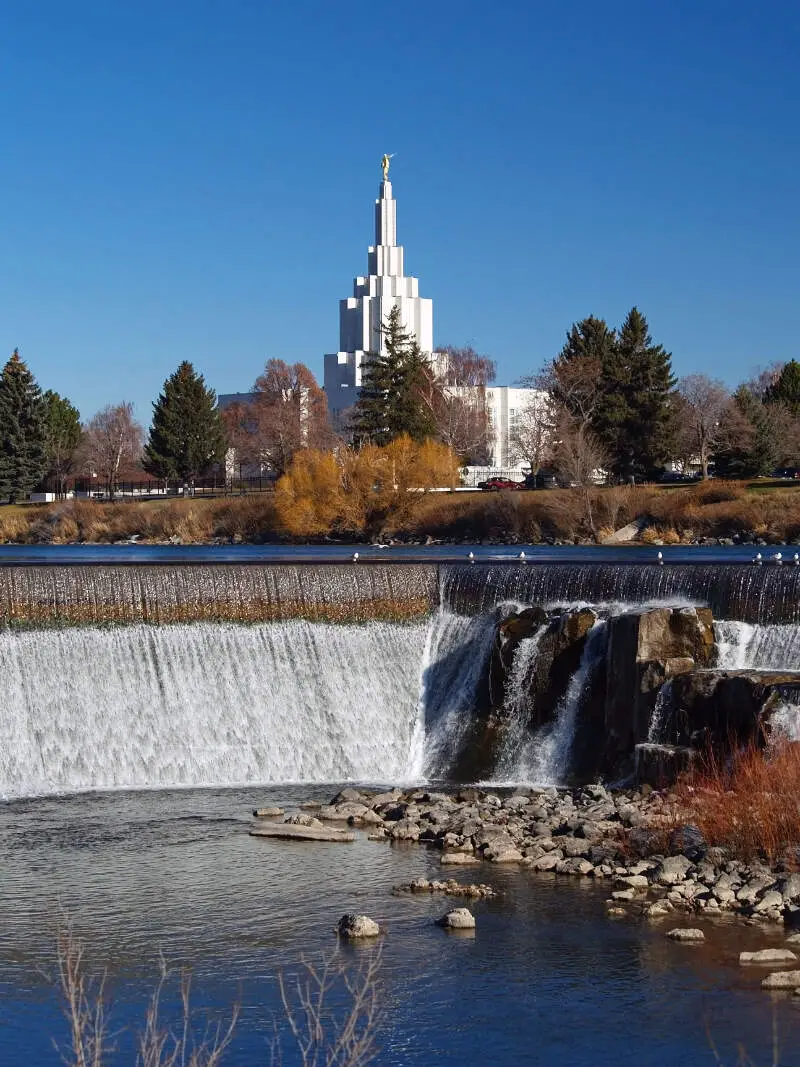
Idaho Falls, ID Photos


1 Reviews & Comments About Idaho Falls

I lived in Idaho Falls, Idaho and it was anything but boring. You googled the most rural parts of these states, but did not give any exposure to their cities. it's easy to sit on your b**t and make lame observations.
Rankings & Articles For Idaho Falls


Locations Around Idaho Falls
Map Of Idaho Falls, ID
Best Places Around Idaho Falls
Shelley, ID
Population 5,092
Rexburg, ID
Population 40,543
Ammon, ID
Population 19,064
Chubbuck, ID
Population 16,126
Blackfoot, ID
Population 12,782
Pocatello, ID
Population 57,635
Idaho Falls Demographics And Statistics
Population over time in Idaho Falls
The current population in Idaho Falls is 67,725. The population has increased 21.7% from 2010.
| Year | Population | % Change |
|---|---|---|
| 2024 | 67,725 | 1.6% |
| 2023 | 66,672 | 1.5% |
| 2022 | 65,685 | 2.0% |
| 2021 | 64,399 | 3.2% |
| 2020 | 62,417 | 1.6% |
| 2019 | 61,459 | 2.2% |
| 2018 | 60,147 | 1.2% |
| 2017 | 59,414 | 0.8% |
| 2016 | 58,933 | 1.0% |
| 2015 | 58,374 | 0.8% |
| 2014 | 57,935 | 0.7% |
| 2013 | 57,536 | 0.9% |
| 2012 | 57,021 | 1.0% |
| 2011 | 56,436 | 1.4% |
| 2010 | 55,653 | - |
Race / Ethnicity in Idaho Falls
See the full breakdown
Idaho Falls is:
77.5% White with 52,461 White residents.
0.5% African American with 324 African American residents.
0.6% American Indian with 407 American Indian residents.
0.5% Asian with 372 Asian residents.
0.3% Hawaiian with 184 Hawaiian residents.
0.1% Other with 93 Other residents.
3.8% Two Or More with 2,598 Two Or More residents.
16.7% Hispanic with 11,286 Hispanic residents.
| Race | Idaho Falls | ID | USA |
|---|---|---|---|
| White | 77.5% | 78.6% | 57.4% |
| African American | 0.5% | 0.7% | 11.9% |
| American Indian | 0.6% | 0.7% | 0.5% |
| Asian | 0.5% | 1.3% | 5.9% |
| Hawaiian | 0.3% | 0.1% | 0.2% |
| Other | 0.1% | 0.6% | 0.6% |
| Two Or More | 3.8% | 4.2% | 4.3% |
| Hispanic | 16.7% | 13.6% | 19.3% |
Gender in Idaho Falls
See the full breakdown
Idaho Falls is 50.4% female with 34,153 female residents.
Idaho Falls is 49.6% male with 33,572 male residents.
| Gender | Idaho Falls | ID | USA |
|---|---|---|---|
| Female | 50.4% | 49.7% | 50.5% |
| Male | 49.6% | 50.3% | 49.5% |
Highest level of educational attainment in Idaho Falls for adults over 25
See the full breakdown
4.0% of adults in Idaho Falls completed < 9th grade.
6.0% of adults in Idaho Falls completed 9-12th grade.
24.0% of adults in Idaho Falls completed high school / ged.
24.0% of adults in Idaho Falls completed some college.
10.0% of adults in Idaho Falls completed associate's degree.
22.0% of adults in Idaho Falls completed bachelor's degree.
6.0% of adults in Idaho Falls completed master's degree.
2.0% of adults in Idaho Falls completed professional degree.
2.0% of adults in Idaho Falls completed doctorate degree.
| Education | Idaho Falls | ID | USA |
|---|---|---|---|
| < 9th Grade | 4.0% | 4.0% | 4.0% |
| 9-12th Grade | 6.0% | 5.0% | 6.0% |
| High School / GED | 24.0% | 26.0% | 26.0% |
| Some College | 24.0% | 24.0% | 19.0% |
| Associate's Degree | 10.0% | 10.0% | 9.0% |
| Bachelor's Degree | 22.0% | 21.0% | 22.0% |
| Master's Degree | 6.0% | 7.0% | 10.0% |
| Professional Degree | 2.0% | 2.0% | 2.0% |
| Doctorate Degree | 2.0% | 1.0% | 2.0% |
Household Income For Idaho Falls, Idaho
See the full breakdown
3.9% of households in Idaho Falls earn Less than $10,000.
2.3% of households in Idaho Falls earn $10,000 to $14,999.
6.2% of households in Idaho Falls earn $15,000 to $24,999.
8.8% of households in Idaho Falls earn $25,000 to $34,999.
11.2% of households in Idaho Falls earn $35,000 to $49,999.
19.5% of households in Idaho Falls earn $50,000 to $74,999.
14.7% of households in Idaho Falls earn $75,000 to $99,999.
16.7% of households in Idaho Falls earn $100,000 to $149,999.
8.4% of households in Idaho Falls earn $150,000 to $199,999.
8.2% of households in Idaho Falls earn $200,000 or more.
| Income | Idaho Falls | ID | USA |
|---|---|---|---|
| Less than $10,000 | 3.9% | 3.6% | 5.0% |
| $10,000 to $14,999 | 2.3% | 2.7% | 3.4% |
| $15,000 to $24,999 | 6.2% | 6.1% | 6.3% |
| $25,000 to $34,999 | 8.8% | 6.6% | 6.6% |
| $35,000 to $49,999 | 11.2% | 11.0% | 10.1% |
| $50,000 to $74,999 | 19.5% | 18.1% | 15.5% |
| $75,000 to $99,999 | 14.7% | 14.7% | 12.6% |
| $100,000 to $149,999 | 16.7% | 19.3% | 17.5% |
| $150,000 to $199,999 | 8.4% | 8.7% | 9.6% |
| $200,000 or more | 8.2% | 9.2% | 13.4% |
Source: U.S. Census ACS 5-year estimates (2024)


