Anderson SnackAbility
Overall SnackAbility
Crime in Anderson summary. We use data from the FBI to determine the crime rates in Anderson. Key points include:
There were 1,481 total crimes in Anderson in the last reporting year.
The overall crime rate per 100,000 people in Anderson is 2,675.5 / 100k people.
The violent crime rate per 100,000 people in Anderson is 419.1 / 100k people.
The property crime rate per 100,000 people in Anderson is 2,256.3 / 100k people.
Overall, crime in Anderson is 26.25% above the national average.
Total Crimes
Above National Average
Crime In Anderson Comparison Table
| Statistic | Count Raw |
Anderson / 100k People |
Indiana / 100k People |
National / 100k People |
|---|---|---|---|---|
| Total Crimes Per 100K | 1,481 | 2,675.5 | 1,691.5 | 2,119.2 |
| Violent Crime | 232 | 419.1 | 312.9 | 359.0 |
| Murder | 3 | 5.4 | 5.5 | 5.0 |
| Robbery | 30 | 54.2 | 34.5 | 61.0 |
| Aggravated Assault | 161 | 290.8 | 239.4 | 256.0 |
| Property Crime | 1,249 | 2,256.3 | 1,378.6 | 1,760.0 |
| Burglary | 150 | 271.0 | 176.8 | 229.0 |
| Larceny | 918 | 1,658.4 | 988.8 | 1,272.0 |
| Car Theft | 181 | 327.0 | 213.0 | 259.0 |
Source: FBI Uniform Crime Reporting (2024)
Cost of living in Anderson summary. We use data on the cost of living to determine how expensive it is to live in Anderson. Real estate prices drive most of the variance in cost of living around Indiana. Key points include:
The cost of living in Anderson is 82 with 100 being average.
The cost of living in Anderson is 0.8x lower than the national average.
The median home value in Anderson is $135,173.
The median income in Anderson is $46,909.
Anderson's Overall Cost Of Living
Lower Than The National Average
Cost Of Living In Anderson Comparison Table
| Living Expense | Anderson | Indiana | National Average |
|---|---|---|---|
| Overall | 82 | 90 | 100 |
| Services | 99 | 97 | 100 |
| Groceries | 95 | 95 | 100 |
| Health | 56 | 72 | 100 |
| Housing | 92 | 98 | 100 |
| Transportation | 92 | 94 | 100 |
| Utilities | 95 | 96 | 100 |
Source: Cost of living index, normalized to US average = 100
Anderson, IN Weather
The average high in Anderson is 61.0° and the average low is 41.4°.
There are 77.1 days of precipitation each year.
Expect an average of 41.2 inches of precipitation each year with 17.4 inches of snow.
| Stat | Anderson |
|---|---|
| Average Annual High | 61.0 |
| Average Annual Low | 41.4 |
| Annual Precipitation Days | 77.1 |
| Average Annual Precipitation | 41.2 |
| Average Annual Snowfall | 17.4 |
Average High
Days of Rain
Source: NOAA climate normals (30-year)
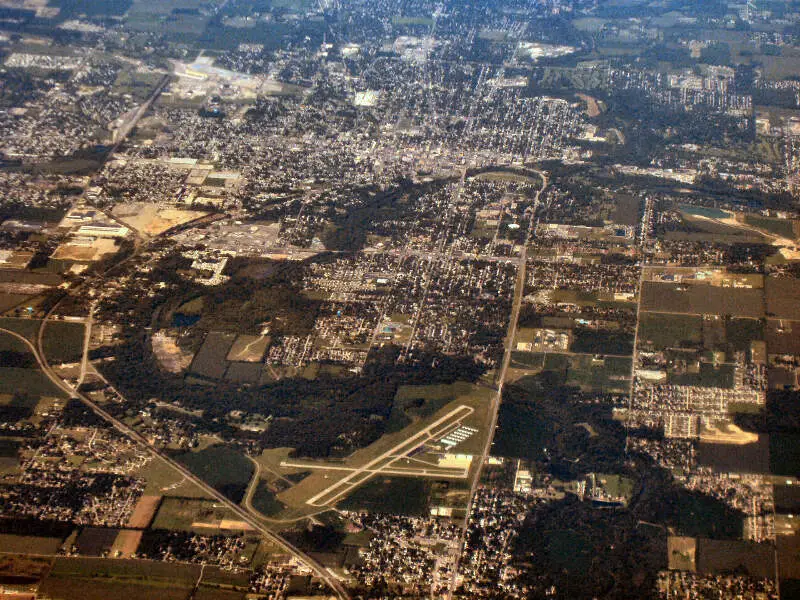
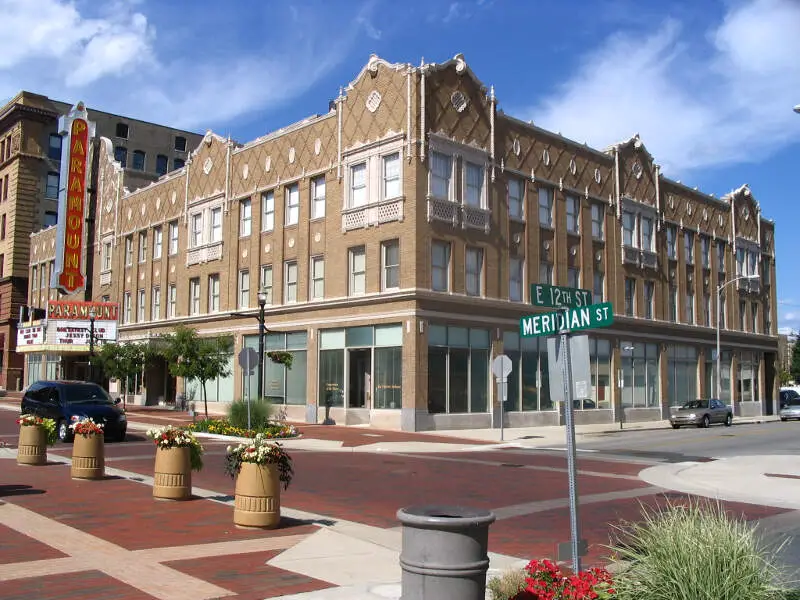
Anderson, IN Photos
8 Reviews & Comments About Anderson

I live in Anderson its terrible its been 2 murders in the last 24hrs here My cousin was murdered here. in broad day light about 5yrs ago. Two of my friends were shot last year I got robbed pistol whipped and almost shot in broad day light in May of this year so u cant tell me Anderson doesnt deserve to be on this list. Im from uptown Westside Brentwood & the downtown 2300 section of Anderson aka Crack City3rd.
& grew up in the Shadeland section of 14th & Sycamore by the Ave Many of my friend have either been murdered or shot or incarcerated. So I'll be moving to Indianapolis soon because I'm tired of it murder & crime has risen significantly people come here from Detroit, Cincinnati, Chicago, Cleveland, Indianapolis just to comit crimes & murders, robberies etc
I was born and raised in Anderson, IN. I haven't live there in 30+ years. At one time Anderson was a great place to live and grow up. General Motors employed a lot of people and we enjoyed a pretty good standard of living. General Motors is now long gone and Anderson is now a slum, deserving of the #2 ranking in this video. If you go south of Indianapolis, Indiana is a pretty nice place. With rolling hills in the southern part of the state, cities like Columbus, Bloomington, Jasper are pretty decent. There are certainly worse places to live than Indiana.
I live in anderson, its not really that bad. Ive not had an problems at all, but i do have to work in indy so all the construction on 69 is kinda getting old.
I lived in anderson for a little while and there was no crime where I was and the school my daughter went to was an A+ school for 5 years straight
Ha I was born in Anderson haven't been there in 20 years
I live in Anderson Indiana hey look there's the police station
I live in Anderson and I'm about to move to Muncie lmao
I don't live in Anderson, but I work here as a mail carrier and have been all over this town. What can I say- This place is a dump. Nobody mows their lawn, most lawns are dead or covered in dog feces. Most of the homes are dilapidated, the city has recently started to demolish abandoned homes. Many of the residence are crackhead on welfare. It's not unusual to see 3 or 4 abandoned homes in a row. Some selling for as low as 5K.
Many homes are rentals. They move in, don't pay the rent, and a few months later they are evicted and the cycle repeats itself every few months.
Driving through the area you can see just how poor the area is. Some houses you swear are abandoned, boarded up windows, holes in the roof and people actually live their.
There are some homes here that have lots of character, but are in need of a lot of repair, but who wants spend 75-100K on a house in this dump- You won't be able to recoup your money.
Rankings & Articles For Anderson


Locations Around Anderson
Map Of Anderson, IN
Best Places Around Anderson
Middletown, KY
Population 9,763
Noblesville, IN
Population 73,362
Muncie, IN
Population 64,751
Elwood, IN
Population 8,356
Anderson Demographics And Statistics
Population over time in Anderson
The current population in Anderson is 55,367. The population has decreased 2.5% from 2010.
| Year | Population | % Change |
|---|---|---|
| 2024 | 55,367 | 0.8% |
| 2023 | 54,930 | -0.1% |
| 2022 | 55,011 | 1.0% |
| 2021 | 54,459 | -0.0% |
| 2020 | 54,476 | -0.1% |
| 2019 | 54,513 | -0.5% |
| 2018 | 54,788 | -0.4% |
| 2017 | 54,986 | -0.6% |
| 2016 | 55,342 | -0.5% |
| 2015 | 55,630 | -0.3% |
| 2014 | 55,789 | -0.7% |
| 2013 | 56,200 | 0.2% |
| 2012 | 56,097 | -0.4% |
| 2011 | 56,298 | -0.8% |
| 2010 | 56,767 | - |
Race / Ethnicity in Anderson
See the full breakdown
Anderson is:
72.5% White with 40,125 White residents.
11.6% African American with 6,436 African American residents.
0.2% American Indian with 116 American Indian residents.
0.6% Asian with 354 Asian residents.
0.0% Hawaiian with 7 Hawaiian residents.
0.3% Other with 155 Other residents.
6.7% Two Or More with 3,686 Two Or More residents.
8.1% Hispanic with 4,488 Hispanic residents.
| Race | Anderson | IN | USA |
|---|---|---|---|
| White | 72.5% | 75.4% | 57.4% |
| African American | 11.6% | 9.1% | 11.9% |
| American Indian | 0.2% | 0.1% | 0.5% |
| Asian | 0.6% | 2.6% | 5.9% |
| Hawaiian | 0.0% | 0.0% | 0.2% |
| Other | 0.3% | 0.4% | 0.6% |
| Two Or More | 6.7% | 3.8% | 4.3% |
| Hispanic | 8.1% | 8.6% | 19.3% |
Gender in Anderson
See the full breakdown
Anderson is 50.6% female with 27,998 female residents.
Anderson is 49.4% male with 27,369 male residents.
| Gender | Anderson | IN | USA |
|---|---|---|---|
| Female | 50.6% | 50.4% | 50.5% |
| Male | 49.4% | 49.6% | 49.5% |
Highest level of educational attainment in Anderson for adults over 25
See the full breakdown
3.0% of adults in Anderson completed < 9th grade.
9.0% of adults in Anderson completed 9-12th grade.
42.0% of adults in Anderson completed high school / ged.
21.0% of adults in Anderson completed some college.
9.0% of adults in Anderson completed associate's degree.
10.0% of adults in Anderson completed bachelor's degree.
5.0% of adults in Anderson completed master's degree.
0.0% of adults in Anderson completed professional degree.
1.0% of adults in Anderson completed doctorate degree.
| Education | Anderson | IN | USA |
|---|---|---|---|
| < 9th Grade | 3.0% | 3.0% | 4.0% |
| 9-12th Grade | 9.0% | 6.0% | 6.0% |
| High School / GED | 42.0% | 33.0% | 26.0% |
| Some College | 21.0% | 19.0% | 19.0% |
| Associate's Degree | 9.0% | 9.0% | 9.0% |
| Bachelor's Degree | 10.0% | 19.0% | 22.0% |
| Master's Degree | 5.0% | 8.0% | 10.0% |
| Professional Degree | 0.0% | 2.0% | 2.0% |
| Doctorate Degree | 1.0% | 1.0% | 2.0% |
Household Income For Anderson, Indiana
See the full breakdown
7.5% of households in Anderson earn Less than $10,000.
6.5% of households in Anderson earn $10,000 to $14,999.
10.6% of households in Anderson earn $15,000 to $24,999.
12.5% of households in Anderson earn $25,000 to $34,999.
16.2% of households in Anderson earn $35,000 to $49,999.
17.9% of households in Anderson earn $50,000 to $74,999.
12.6% of households in Anderson earn $75,000 to $99,999.
10.9% of households in Anderson earn $100,000 to $149,999.
2.9% of households in Anderson earn $150,000 to $199,999.
2.2% of households in Anderson earn $200,000 or more.
| Income | Anderson | IN | USA |
|---|---|---|---|
| Less than $10,000 | 7.5% | 4.9% | 5.0% |
| $10,000 to $14,999 | 6.5% | 3.4% | 3.4% |
| $15,000 to $24,999 | 10.6% | 6.8% | 6.3% |
| $25,000 to $34,999 | 12.5% | 7.5% | 6.6% |
| $35,000 to $49,999 | 16.2% | 11.8% | 10.1% |
| $50,000 to $74,999 | 17.9% | 17.7% | 15.5% |
| $75,000 to $99,999 | 12.6% | 13.9% | 12.6% |
| $100,000 to $149,999 | 10.9% | 17.5% | 17.5% |
| $150,000 to $199,999 | 2.9% | 8.3% | 9.6% |
| $200,000 or more | 2.2% | 8.2% | 13.4% |
Source: U.S. Census ACS 5-year estimates (2024)


