Muncie SnackAbility
Overall SnackAbility
Crime in Muncie summary. We use data from the FBI to determine the crime rates in Muncie. Key points include:
There were 1,861 total crimes in Muncie in the last reporting year.
The overall crime rate per 100,000 people in Muncie is 2,859.9 / 100k people.
The violent crime rate per 100,000 people in Muncie is 602.4 / 100k people.
The property crime rate per 100,000 people in Muncie is 2,257.5 / 100k people.
Overall, crime in Muncie is 34.95% above the national average.
Total Crimes
Above National Average
Crime In Muncie Comparison Table
| Statistic | Count Raw |
Muncie / 100k People |
Indiana / 100k People |
National / 100k People |
|---|---|---|---|---|
| Total Crimes Per 100K | 1,861 | 2,859.9 | 1,691.5 | 2,119.2 |
| Violent Crime | 392 | 602.4 | 312.9 | 359.0 |
| Murder | 3 | 4.6 | 5.5 | 5.0 |
| Robbery | 23 | 35.3 | 34.5 | 61.0 |
| Aggravated Assault | 310 | 476.4 | 239.4 | 256.0 |
| Property Crime | 1,469 | 2,257.5 | 1,378.6 | 1,760.0 |
| Burglary | 282 | 433.4 | 176.8 | 229.0 |
| Larceny | 938 | 1,441.5 | 988.8 | 1,272.0 |
| Car Theft | 249 | 382.7 | 213.0 | 259.0 |
Source: FBI Uniform Crime Reporting (2024)
Cost of living in Muncie summary. We use data on the cost of living to determine how expensive it is to live in Muncie. Real estate prices drive most of the variance in cost of living around Indiana. Key points include:
The cost of living in Muncie is 80 with 100 being average.
The cost of living in Muncie is 0.8x lower than the national average.
The median home value in Muncie is $151,291.
The median income in Muncie is $44,471.
Muncie's Overall Cost Of Living
Lower Than The National Average
Cost Of Living In Muncie Comparison Table
| Living Expense | Muncie | Indiana | National Average |
|---|---|---|---|
| Overall | 80 | 90 | 100 |
| Services | 96 | 97 | 100 |
| Groceries | 97 | 95 | 100 |
| Health | 51 | 72 | 100 |
| Housing | 95 | 98 | 100 |
| Transportation | 92 | 94 | 100 |
| Utilities | 93 | 96 | 100 |
Source: Cost of living index, normalized to US average = 100
Muncie, IN Weather
The average high in Muncie is 60.9° and the average low is 41.0°.
There are 78.4 days of precipitation each year.
Expect an average of 40.4 inches of precipitation each year with 22.4 inches of snow.
| Stat | Muncie |
|---|---|
| Average Annual High | 60.9 |
| Average Annual Low | 41.0 |
| Annual Precipitation Days | 78.4 |
| Average Annual Precipitation | 40.4 |
| Average Annual Snowfall | 22.4 |
Average High
Days of Rain
Source: NOAA climate normals (30-year)
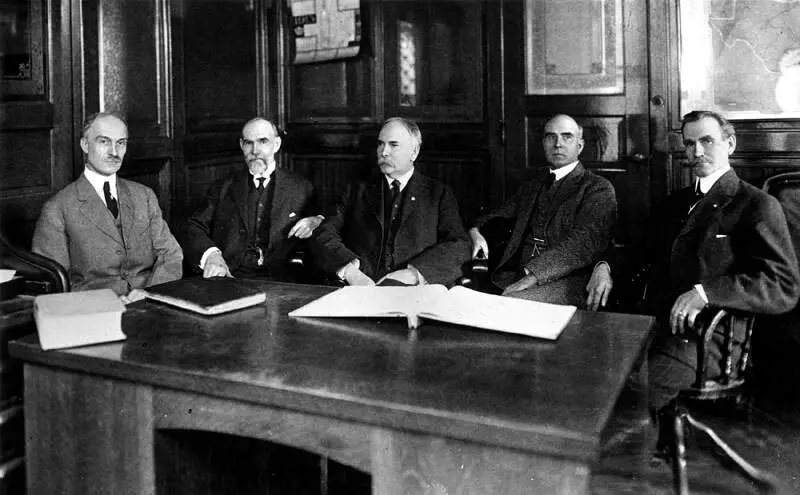
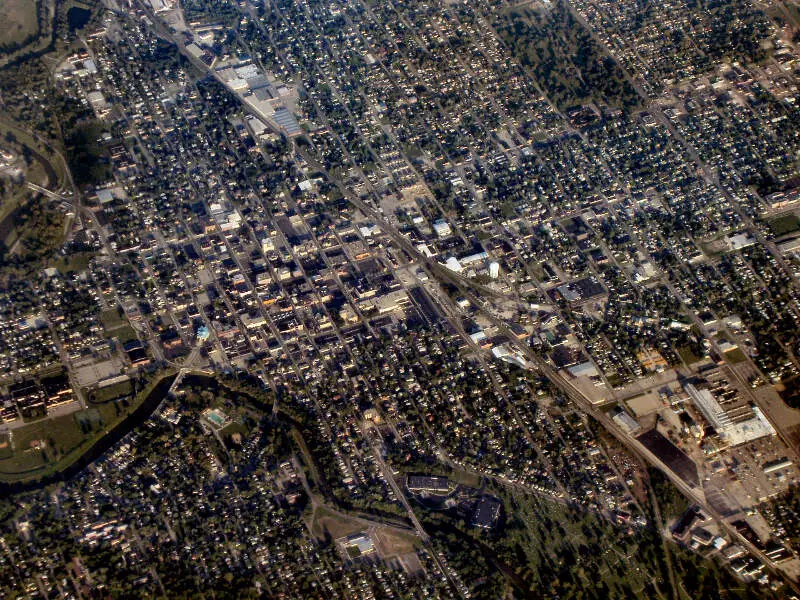
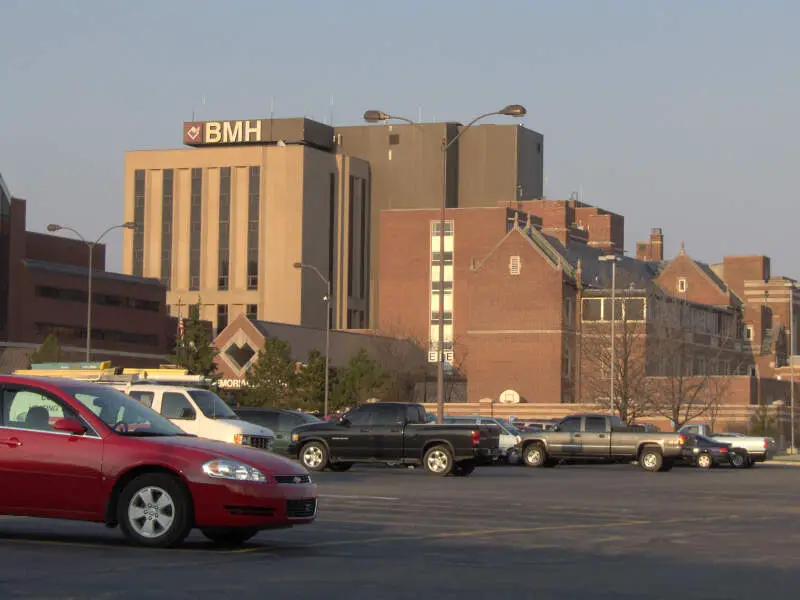
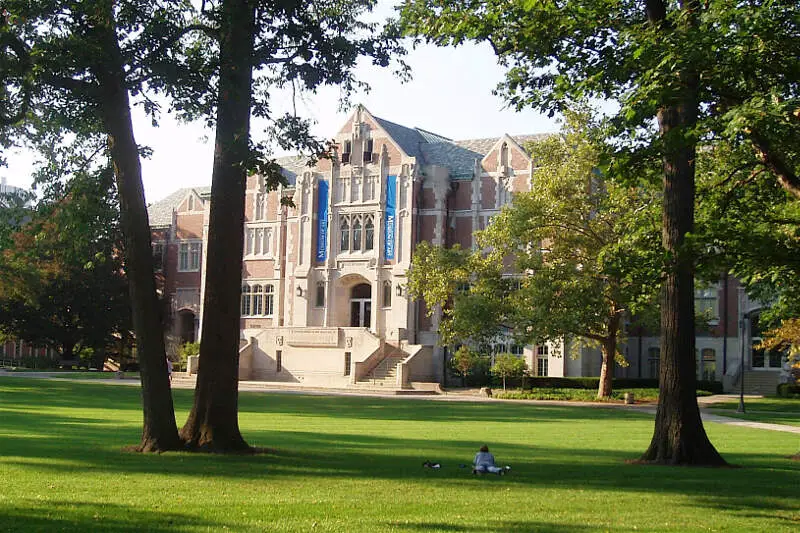
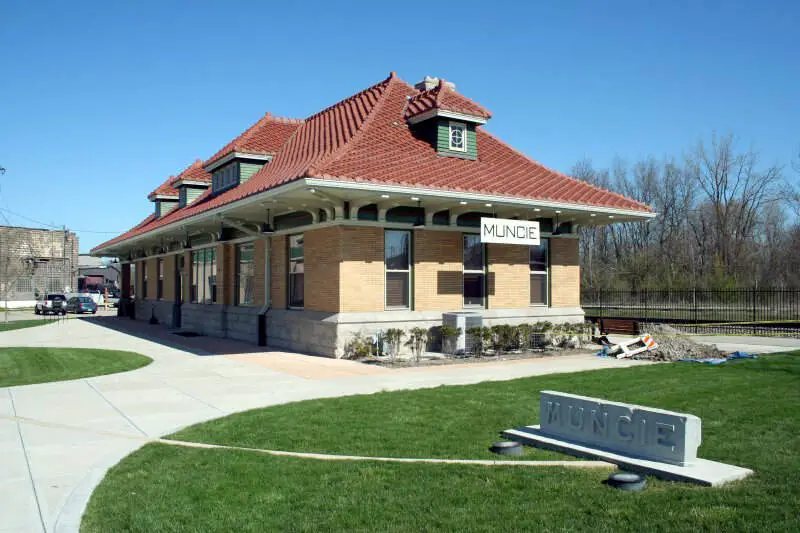
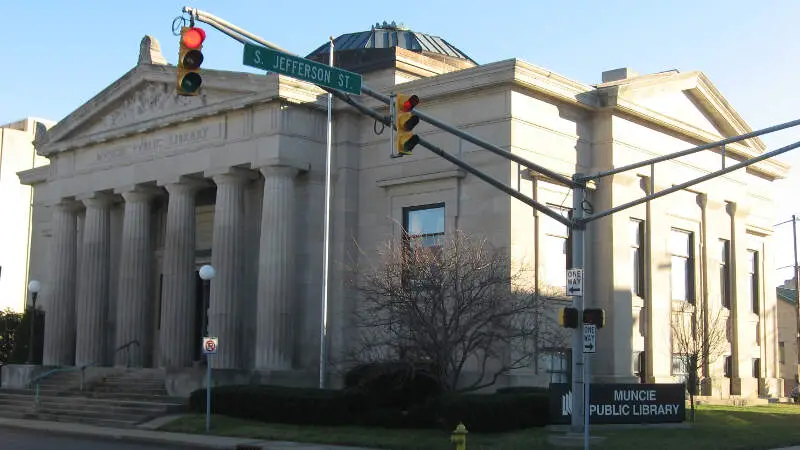
Muncie, IN Photos


1 Reviews & Comments About Muncie

Muncie is a good place to live I've lived here I just got a good church here who used to be ball jars The Ball Brothers and they went out of business and they used to be General Motors here.
Thanks to president Jimmy Carter and how did he do that and why am I blaming him well he's the one that set of having people to buy Japanese cars and when they did that that shut down General Motors he's not he's the one that shut down the factories Muncie and Anderson to the Democrats.
Rankings & Articles For Muncie


Locations Around Muncie
Map Of Muncie, IN
Best Places Around Muncie
Union, OH
Population 7,037
Greenville, OH
Population 12,741
Union, KY
Population 7,642
Middletown, KY
Population 9,763
Zionsville, IN
Population 32,095
Carmel, IN
Population 101,651
Noblesville, IN
Population 73,362
Westfield, IN
Population 54,677
Lawrence, IN
Population 49,517
Muncie Demographics And Statistics
Population over time in Muncie
The current population in Muncie is 64,751. The population has decreased 7.5% from 2010.
| Year | Population | % Change |
|---|---|---|
| 2024 | 64,751 | 0.0% |
| 2023 | 64,739 | -0.7% |
| 2022 | 65,167 | -0.6% |
| 2021 | 65,571 | -3.2% |
| 2020 | 67,739 | -1.5% |
| 2019 | 68,750 | -0.6% |
| 2018 | 69,164 | -0.1% |
| 2017 | 69,237 | -0.5% |
| 2016 | 69,583 | -0.8% |
| 2015 | 70,173 | 0.2% |
| 2014 | 70,035 | 0.1% |
| 2013 | 69,989 | -0.1% |
| 2012 | 70,033 | 0.2% |
| 2011 | 69,869 | -0.2% |
| 2010 | 70,017 | - |
Race / Ethnicity in Muncie
See the full breakdown
Muncie is:
78.4% White with 50,797 White residents.
8.1% African American with 5,217 African American residents.
0.2% American Indian with 127 American Indian residents.
2.1% Asian with 1,348 Asian residents.
0.0% Hawaiian with 0 Hawaiian residents.
0.7% Other with 444 Other residents.
6.2% Two Or More with 3,984 Two Or More residents.
4.4% Hispanic with 2,834 Hispanic residents.
| Race | Muncie | IN | USA |
|---|---|---|---|
| White | 78.4% | 75.4% | 57.4% |
| African American | 8.1% | 9.1% | 11.9% |
| American Indian | 0.2% | 0.1% | 0.5% |
| Asian | 2.1% | 2.6% | 5.9% |
| Hawaiian | 0.0% | 0.0% | 0.2% |
| Other | 0.7% | 0.4% | 0.6% |
| Two Or More | 6.2% | 3.8% | 4.3% |
| Hispanic | 4.4% | 8.6% | 19.3% |
Gender in Muncie
See the full breakdown
Muncie is 52.9% female with 34,260 female residents.
Muncie is 47.1% male with 30,491 male residents.
| Gender | Muncie | IN | USA |
|---|---|---|---|
| Female | 52.9% | 50.4% | 50.5% |
| Male | 47.1% | 49.6% | 49.5% |
Highest level of educational attainment in Muncie for adults over 25
See the full breakdown
4.0% of adults in Muncie completed < 9th grade.
9.0% of adults in Muncie completed 9-12th grade.
33.0% of adults in Muncie completed high school / ged.
19.0% of adults in Muncie completed some college.
9.0% of adults in Muncie completed associate's degree.
15.0% of adults in Muncie completed bachelor's degree.
8.0% of adults in Muncie completed master's degree.
1.0% of adults in Muncie completed professional degree.
2.0% of adults in Muncie completed doctorate degree.
| Education | Muncie | IN | USA |
|---|---|---|---|
| < 9th Grade | 4.0% | 3.0% | 4.0% |
| 9-12th Grade | 9.0% | 6.0% | 6.0% |
| High School / GED | 33.0% | 33.0% | 26.0% |
| Some College | 19.0% | 19.0% | 19.0% |
| Associate's Degree | 9.0% | 9.0% | 9.0% |
| Bachelor's Degree | 15.0% | 19.0% | 22.0% |
| Master's Degree | 8.0% | 8.0% | 10.0% |
| Professional Degree | 1.0% | 2.0% | 2.0% |
| Doctorate Degree | 2.0% | 1.0% | 2.0% |
Household Income For Muncie, Indiana
See the full breakdown
9.4% of households in Muncie earn Less than $10,000.
7.0% of households in Muncie earn $10,000 to $14,999.
11.2% of households in Muncie earn $15,000 to $24,999.
12.7% of households in Muncie earn $25,000 to $34,999.
15.1% of households in Muncie earn $35,000 to $49,999.
17.0% of households in Muncie earn $50,000 to $74,999.
11.5% of households in Muncie earn $75,000 to $99,999.
10.8% of households in Muncie earn $100,000 to $149,999.
3.3% of households in Muncie earn $150,000 to $199,999.
2.0% of households in Muncie earn $200,000 or more.
| Income | Muncie | IN | USA |
|---|---|---|---|
| Less than $10,000 | 9.4% | 4.9% | 5.0% |
| $10,000 to $14,999 | 7.0% | 3.4% | 3.4% |
| $15,000 to $24,999 | 11.2% | 6.8% | 6.3% |
| $25,000 to $34,999 | 12.7% | 7.5% | 6.6% |
| $35,000 to $49,999 | 15.1% | 11.8% | 10.1% |
| $50,000 to $74,999 | 17.0% | 17.7% | 15.5% |
| $75,000 to $99,999 | 11.5% | 13.9% | 12.6% |
| $100,000 to $149,999 | 10.8% | 17.5% | 17.5% |
| $150,000 to $199,999 | 3.3% | 8.3% | 9.6% |
| $200,000 or more | 2.0% | 8.2% | 13.4% |
Source: U.S. Census ACS 5-year estimates (2024)


