Bloomington SnackAbility
Overall SnackAbility
Crime in Bloomington summary. We use data from the FBI to determine the crime rates in Bloomington. Key points include:
There were 2,367 total crimes in Bloomington in the last reporting year.
The overall crime rate per 100,000 people in Bloomington is 3,005.3 / 100k people.
The violent crime rate per 100,000 people in Bloomington is 286.9 / 100k people.
The property crime rate per 100,000 people in Bloomington is 2,718.3 / 100k people.
Overall, crime in Bloomington is 41.81% above the national average.
Total Crimes
Above National Average
Crime In Bloomington Comparison Table
| Statistic | Count Raw |
Bloomington / 100k People |
Indiana / 100k People |
National / 100k People |
|---|---|---|---|---|
| Total Crimes Per 100K | 2,367 | 3,005.3 | 1,691.5 | 2,119.2 |
| Violent Crime | 226 | 286.9 | 312.9 | 359.0 |
| Murder | 3 | 3.8 | 5.5 | 5.0 |
| Robbery | 44 | 55.9 | 34.5 | 61.0 |
| Aggravated Assault | 131 | 166.3 | 239.4 | 256.0 |
| Property Crime | 2,141 | 2,718.3 | 1,378.6 | 1,760.0 |
| Burglary | 178 | 226.0 | 176.8 | 229.0 |
| Larceny | 1,832 | 2,326.0 | 988.8 | 1,272.0 |
| Car Theft | 131 | 166.3 | 213.0 | 259.0 |
Source: FBI Uniform Crime Reporting (2024)
Cost of living in Bloomington summary. We use data on the cost of living to determine how expensive it is to live in Bloomington. Real estate prices drive most of the variance in cost of living around Indiana. Key points include:
The cost of living in Bloomington is 103 with 100 being average.
The cost of living in Bloomington is 1.0x higher than the national average.
The median home value in Bloomington is $313,959.
The median income in Bloomington is $50,465.
Bloomington's Overall Cost Of Living
Higher Than The National Average
Cost Of Living In Bloomington Comparison Table
| Living Expense | Bloomington | Indiana | National Average |
|---|---|---|---|
| Overall | 103 | 90 | 100 |
| Services | 97 | 97 | 100 |
| Groceries | 96 | 95 | 100 |
| Health | 115 | 72 | 100 |
| Housing | 97 | 98 | 100 |
| Transportation | 98 | 94 | 100 |
| Utilities | 98 | 96 | 100 |
Source: Cost of living index, normalized to US average = 100
Bloomington, IN Weather
The average high in Bloomington is 63.6° and the average low is 43.7°.
There are 79.6 days of precipitation each year.
Expect an average of 47.0 inches of precipitation each year with 15.8 inches of snow.
| Stat | Bloomington |
|---|---|
| Average Annual High | 63.6 |
| Average Annual Low | 43.7 |
| Annual Precipitation Days | 79.6 |
| Average Annual Precipitation | 47.0 |
| Average Annual Snowfall | 15.8 |
Average High
Days of Rain
Source: NOAA climate normals (30-year)
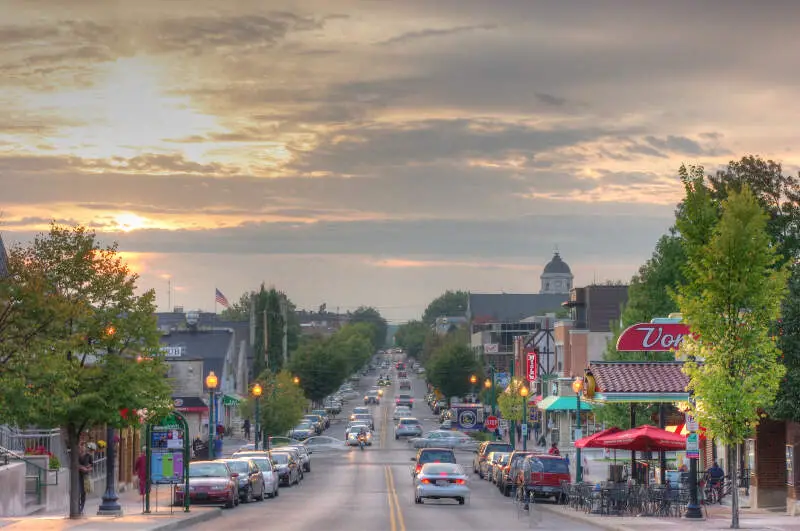
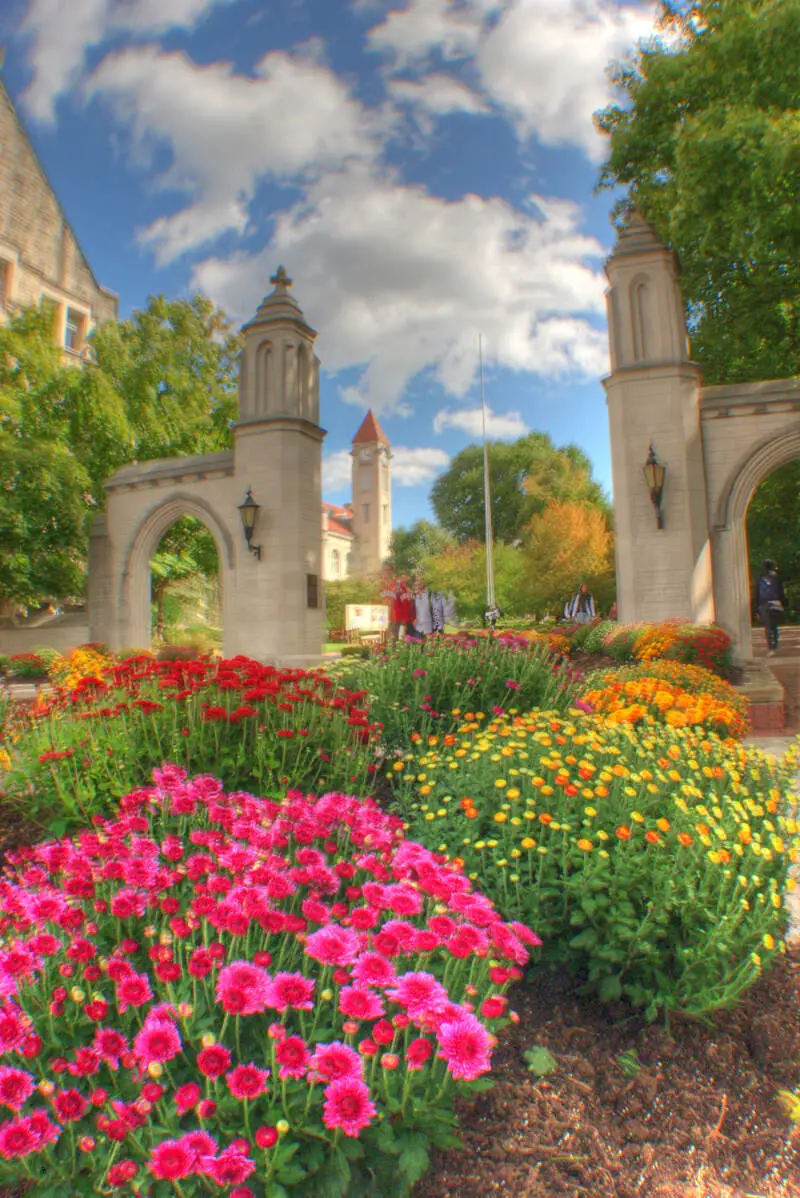
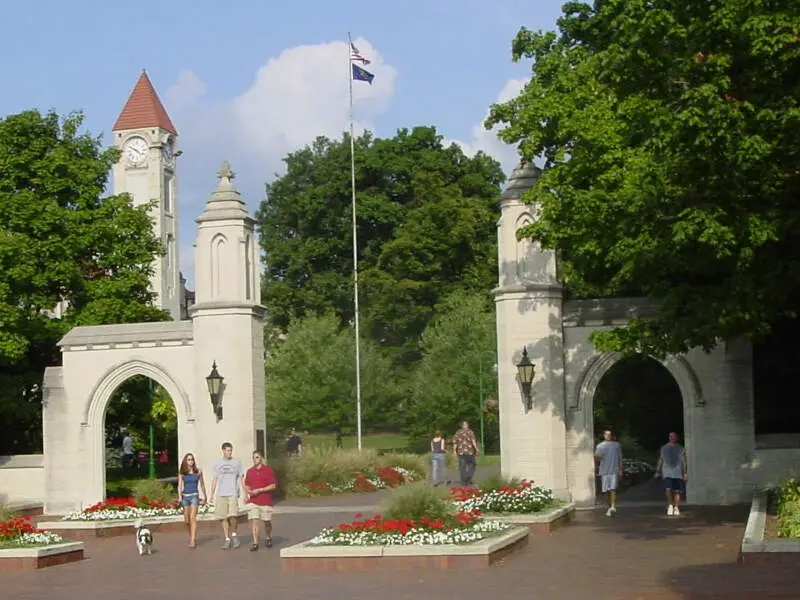
Bloomington, IN Photos

1 Reviews & Comments About Bloomington

I live in bedford and go to Bloomington all the time this place is really peaceful I have been here for three years never been to any of these other cities
Rankings & Articles For Bloomington


Locations Around Bloomington
Map Of Bloomington, IN
Best Places Around Bloomington
Brownsburg, IN
Population 31,215
New Whiteland, IN
Population 5,704
Danville, IN
Population 11,714
Columbus, IN
Population 51,824
Elizabethtown, KY
Population 32,576
Greenwood, IN
Population 66,029
Bargersville, IN
Population 10,752
Washington, IN
Population 12,367
Ellettsville, IN
Population 6,698
Mooresville, IN
Population 9,751
Bloomington Demographics And Statistics
Population over time in Bloomington
The current population in Bloomington is 80,049. The population has increased 2.0% from 2010.
| Year | Population | % Change |
|---|---|---|
| 2024 | 80,049 | 1.6% |
| 2023 | 78,791 | -0.3% |
| 2022 | 79,006 | -1.3% |
| 2021 | 80,064 | -5.5% |
| 2020 | 84,691 | 0.7% |
| 2019 | 84,116 | 0.1% |
| 2018 | 84,058 | 0.5% |
| 2017 | 83,636 | 0.7% |
| 2016 | 83,093 | 0.3% |
| 2015 | 82,813 | 1.0% |
| 2014 | 81,963 | 1.0% |
| 2013 | 81,115 | 0.8% |
| 2012 | 80,440 | 1.0% |
| 2011 | 79,662 | 1.5% |
| 2010 | 78,490 | - |
Race / Ethnicity in Bloomington
See the full breakdown
Bloomington is:
74.3% White with 59,488 White residents.
4.9% African American with 3,939 African American residents.
0.0% American Indian with 25 American Indian residents.
10.7% Asian with 8,592 Asian residents.
0.0% Hawaiian with 24 Hawaiian residents.
0.3% Other with 227 Other residents.
4.2% Two Or More with 3,349 Two Or More residents.
5.5% Hispanic with 4,405 Hispanic residents.
| Race | Bloomington | IN | USA |
|---|---|---|---|
| White | 74.3% | 75.4% | 57.4% |
| African American | 4.9% | 9.1% | 11.9% |
| American Indian | 0.0% | 0.1% | 0.5% |
| Asian | 10.7% | 2.6% | 5.9% |
| Hawaiian | 0.0% | 0.0% | 0.2% |
| Other | 0.3% | 0.4% | 0.6% |
| Two Or More | 4.2% | 3.8% | 4.3% |
| Hispanic | 5.5% | 8.6% | 19.3% |
Gender in Bloomington
See the full breakdown
Bloomington is 50.4% female with 40,324 female residents.
Bloomington is 49.6% male with 39,724 male residents.
| Gender | Bloomington | IN | USA |
|---|---|---|---|
| Female | 50.4% | 50.4% | 50.5% |
| Male | 49.6% | 49.6% | 49.5% |
Highest level of educational attainment in Bloomington for adults over 25
See the full breakdown
1.0% of adults in Bloomington completed < 9th grade.
4.0% of adults in Bloomington completed 9-12th grade.
16.0% of adults in Bloomington completed high school / ged.
15.0% of adults in Bloomington completed some college.
5.0% of adults in Bloomington completed associate's degree.
25.0% of adults in Bloomington completed bachelor's degree.
22.0% of adults in Bloomington completed master's degree.
4.0% of adults in Bloomington completed professional degree.
8.0% of adults in Bloomington completed doctorate degree.
| Education | Bloomington | IN | USA |
|---|---|---|---|
| < 9th Grade | 1.0% | 3.0% | 4.0% |
| 9-12th Grade | 4.0% | 6.0% | 6.0% |
| High School / GED | 16.0% | 33.0% | 26.0% |
| Some College | 15.0% | 19.0% | 19.0% |
| Associate's Degree | 5.0% | 9.0% | 9.0% |
| Bachelor's Degree | 25.0% | 19.0% | 22.0% |
| Master's Degree | 22.0% | 8.0% | 10.0% |
| Professional Degree | 4.0% | 2.0% | 2.0% |
| Doctorate Degree | 8.0% | 1.0% | 2.0% |
Household Income For Bloomington, Indiana
See the full breakdown
13.7% of households in Bloomington earn Less than $10,000.
6.2% of households in Bloomington earn $10,000 to $14,999.
9.8% of households in Bloomington earn $15,000 to $24,999.
8.8% of households in Bloomington earn $25,000 to $34,999.
11.1% of households in Bloomington earn $35,000 to $49,999.
15.7% of households in Bloomington earn $50,000 to $74,999.
10.3% of households in Bloomington earn $75,000 to $99,999.
11.4% of households in Bloomington earn $100,000 to $149,999.
5.2% of households in Bloomington earn $150,000 to $199,999.
7.7% of households in Bloomington earn $200,000 or more.
| Income | Bloomington | IN | USA |
|---|---|---|---|
| Less than $10,000 | 13.7% | 4.9% | 5.0% |
| $10,000 to $14,999 | 6.2% | 3.4% | 3.4% |
| $15,000 to $24,999 | 9.8% | 6.8% | 6.3% |
| $25,000 to $34,999 | 8.8% | 7.5% | 6.6% |
| $35,000 to $49,999 | 11.1% | 11.8% | 10.1% |
| $50,000 to $74,999 | 15.7% | 17.7% | 15.5% |
| $75,000 to $99,999 | 10.3% | 13.9% | 12.6% |
| $100,000 to $149,999 | 11.4% | 17.5% | 17.5% |
| $150,000 to $199,999 | 5.2% | 8.3% | 9.6% |
| $200,000 or more | 7.7% | 8.2% | 13.4% |
Source: U.S. Census ACS 5-year estimates (2024)


