Elizabethtown SnackAbility
Overall SnackAbility
Crime in Elizabethtown summary. We use data from the FBI to determine the crime rates in Elizabethtown. Key points include:
There were 280 total crimes in Elizabethtown in the last reporting year.
The overall crime rate per 100,000 people in Elizabethtown is 835.3 / 100k people.
The violent crime rate per 100,000 people in Elizabethtown is 137.2 / 100k people.
The property crime rate per 100,000 people in Elizabethtown is 698.0 / 100k people.
Overall, crime in Elizabethtown is -60.59% below the national average.
Total Crimes
Below National Average
Crime In Elizabethtown Comparison Table
| Statistic | Count Raw |
Elizabethtown / 100k People |
Kentucky / 100k People |
National / 100k People |
|---|---|---|---|---|
| Total Crimes Per 100K | 280 | 835.3 | 1,563.0 | 2,119.2 |
| Violent Crime | 46 | 137.2 | 213.1 | 359.0 |
| Murder | 4 | 11.9 | 6.1 | 5.0 |
| Robbery | 4 | 11.9 | 35.1 | 61.0 |
| Aggravated Assault | 23 | 68.6 | 139.5 | 256.0 |
| Property Crime | 234 | 698.0 | 1,349.9 | 1,760.0 |
| Burglary | 40 | 119.3 | 193.6 | 229.0 |
| Larceny | 159 | 474.3 | 930.2 | 1,272.0 |
| Car Theft | 35 | 104.4 | 226.2 | 259.0 |
Source: FBI Uniform Crime Reporting (2024)
Cost of living in Elizabethtown summary. We use data on the cost of living to determine how expensive it is to live in Elizabethtown. Real estate prices drive most of the variance in cost of living around Kentucky. Key points include:
The cost of living in Elizabethtown is 93 with 100 being average.
The cost of living in Elizabethtown is 0.9x lower than the national average.
The median home value in Elizabethtown is $268,312.
The median income in Elizabethtown is $60,760.
Elizabethtown's Overall Cost Of Living
Lower Than The National Average
Cost Of Living In Elizabethtown Comparison Table
| Living Expense | Elizabethtown | Kentucky | National Average |
|---|---|---|---|
| Overall | 93 | 89 | 100 |
| Services | 98 | 100 | 100 |
| Groceries | 98 | 98 | 100 |
| Health | 89 | 68 | 100 |
| Housing | 98 | 98 | 100 |
| Transportation | 93 | 95 | 100 |
| Utilities | 97 | 96 | 100 |
Source: Cost of living index, normalized to US average = 100
Elizabethtown, KY Weather
The average high in Elizabethtown is 66.7° and the average low is 45.2°.
There are 76.5 days of precipitation each year.
Expect an average of 47.4 inches of precipitation each year with 3.5 inches of snow.
| Stat | Elizabethtown |
|---|---|
| Average Annual High | 66.7 |
| Average Annual Low | 45.2 |
| Annual Precipitation Days | 76.5 |
| Average Annual Precipitation | 47.4 |
| Average Annual Snowfall | 3.5 |
Average High
Days of Rain
Source: NOAA climate normals (30-year)
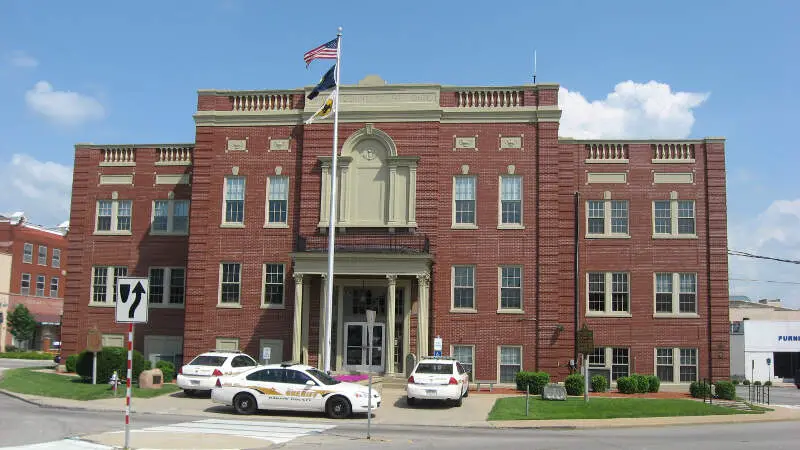
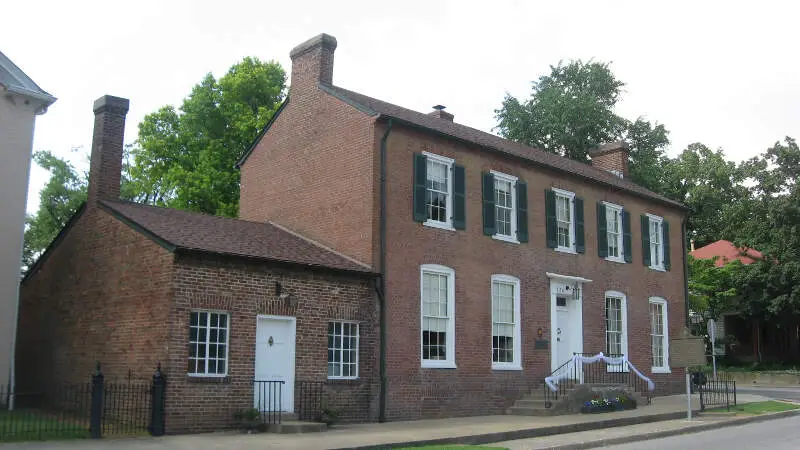
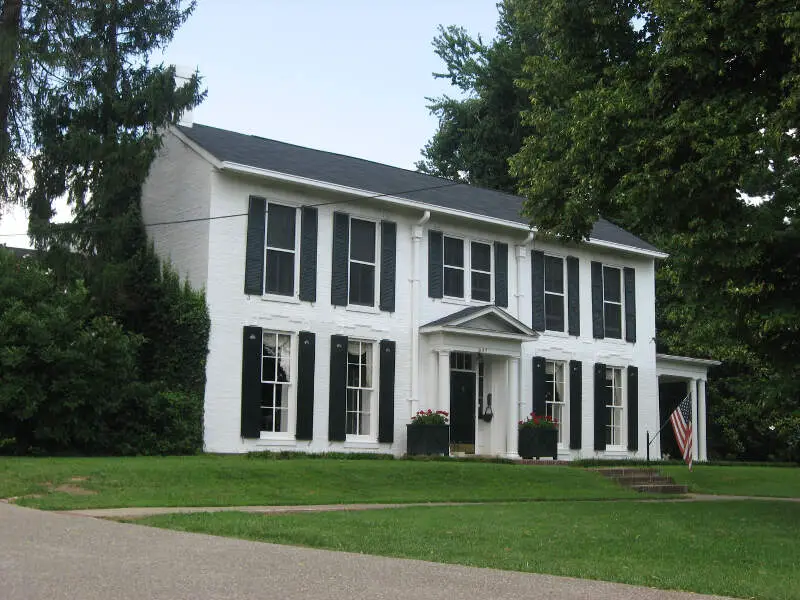
Elizabethtown, KY Photos
1 Reviews & Comments About Elizabethtown

Elizabethtown, KY is a very friendly & kind community of people.
Freeman Lake has walking trails & dog park. Play grounds for the kids
Impellizerri's downtown is fantastic pizza place to eat.
In Glendale from Etown the Whistle Stop is well know home cooking restaurant. Lots of antique shops to browse thru.
Rankings & Articles For Elizabethtown


Locations Around Elizabethtown
Map Of Elizabethtown, KY
Best Places Around Elizabethtown
Carmi, IL
Population 4,845
Carterville, IL
Population 5,818
Marion, IL
Population 16,836
Herrin, IL
Population 12,226
Mount Vernon, IN
Population 6,400
Hendron, KY
Population 4,495
Morganfield, KY
Population 3,185
Madisonville, KY
Population 19,515
Elizabethtown Demographics And Statistics
Population over time in Elizabethtown
The current population in Elizabethtown is 32,576. The population has increased 21.5% from 2010.
| Year | Population | % Change |
|---|---|---|
| 2024 | 32,576 | 2.2% |
| 2023 | 31,870 | 1.4% |
| 2022 | 31,425 | 1.2% |
| 2021 | 31,066 | 2.9% |
| 2020 | 30,179 | 1.9% |
| 2019 | 29,620 | 0.5% |
| 2018 | 29,474 | -1.1% |
| 2017 | 29,794 | -0.1% |
| 2016 | 29,835 | 0.6% |
| 2015 | 29,657 | 0.7% |
| 2014 | 29,464 | 1.8% |
| 2013 | 28,940 | 2.4% |
| 2012 | 28,254 | 2.5% |
| 2011 | 27,574 | 2.8% |
| 2010 | 26,822 | - |
Race / Ethnicity in Elizabethtown
See the full breakdown
Elizabethtown is:
74.3% White with 24,208 White residents.
11.5% African American with 3,735 African American residents.
0.1% American Indian with 27 American Indian residents.
3.1% Asian with 1,004 Asian residents.
0.0% Hawaiian with 0 Hawaiian residents.
0.1% Other with 39 Other residents.
5.4% Two Or More with 1,748 Two Or More residents.
5.6% Hispanic with 1,815 Hispanic residents.
| Race | Elizabethtown | KY | USA |
|---|---|---|---|
| White | 74.3% | 81.5% | 57.4% |
| African American | 11.5% | 7.6% | 11.9% |
| American Indian | 0.1% | 0.1% | 0.5% |
| Asian | 3.1% | 1.6% | 5.9% |
| Hawaiian | 0.0% | 0.1% | 0.2% |
| Other | 0.1% | 0.3% | 0.6% |
| Two Or More | 5.4% | 3.9% | 4.3% |
| Hispanic | 5.6% | 5.0% | 19.3% |
Gender in Elizabethtown
See the full breakdown
Elizabethtown is 53.1% female with 17,297 female residents.
Elizabethtown is 46.9% male with 15,279 male residents.
| Gender | Elizabethtown | KY | USA |
|---|---|---|---|
| Female | 53.1% | 50.5% | 50.5% |
| Male | 46.9% | 49.5% | 49.5% |
Highest level of educational attainment in Elizabethtown for adults over 25
See the full breakdown
1.0% of adults in Elizabethtown completed < 9th grade.
4.0% of adults in Elizabethtown completed 9-12th grade.
28.0% of adults in Elizabethtown completed high school / ged.
28.0% of adults in Elizabethtown completed some college.
10.0% of adults in Elizabethtown completed associate's degree.
17.0% of adults in Elizabethtown completed bachelor's degree.
9.0% of adults in Elizabethtown completed master's degree.
2.0% of adults in Elizabethtown completed professional degree.
1.0% of adults in Elizabethtown completed doctorate degree.
| Education | Elizabethtown | KY | USA |
|---|---|---|---|
| < 9th Grade | 1.0% | 4.0% | 4.0% |
| 9-12th Grade | 4.0% | 7.0% | 6.0% |
| High School / GED | 28.0% | 33.0% | 26.0% |
| Some College | 28.0% | 20.0% | 19.0% |
| Associate's Degree | 10.0% | 9.0% | 9.0% |
| Bachelor's Degree | 17.0% | 16.0% | 22.0% |
| Master's Degree | 9.0% | 8.0% | 10.0% |
| Professional Degree | 2.0% | 2.0% | 2.0% |
| Doctorate Degree | 1.0% | 1.0% | 2.0% |
Household Income For Elizabethtown, Kentucky
See the full breakdown
4.3% of households in Elizabethtown earn Less than $10,000.
7.3% of households in Elizabethtown earn $10,000 to $14,999.
10.4% of households in Elizabethtown earn $15,000 to $24,999.
6.9% of households in Elizabethtown earn $25,000 to $34,999.
10.9% of households in Elizabethtown earn $35,000 to $49,999.
22.5% of households in Elizabethtown earn $50,000 to $74,999.
11.9% of households in Elizabethtown earn $75,000 to $99,999.
12.0% of households in Elizabethtown earn $100,000 to $149,999.
6.7% of households in Elizabethtown earn $150,000 to $199,999.
7.1% of households in Elizabethtown earn $200,000 or more.
| Income | Elizabethtown | KY | USA |
|---|---|---|---|
| Less than $10,000 | 4.3% | 6.1% | 5.0% |
| $10,000 to $14,999 | 7.3% | 5.2% | 3.4% |
| $15,000 to $24,999 | 10.4% | 8.3% | 6.3% |
| $25,000 to $34,999 | 6.9% | 8.3% | 6.6% |
| $35,000 to $49,999 | 10.9% | 12.1% | 10.1% |
| $50,000 to $74,999 | 22.5% | 17.1% | 15.5% |
| $75,000 to $99,999 | 11.9% | 12.8% | 12.6% |
| $100,000 to $149,999 | 12.0% | 15.9% | 17.5% |
| $150,000 to $199,999 | 6.7% | 7.1% | 9.6% |
| $200,000 or more | 7.1% | 7.2% | 13.4% |
Source: U.S. Census ACS 5-year estimates (2024)


