Brazil SnackAbility
Overall SnackAbility
Cost of living in Brazil summary. We use data on the cost of living to determine how expensive it is to live in Brazil. Real estate prices drive most of the variance in cost of living around Indiana. Key points include:
The cost of living in Brazil is 87 with 100 being average.
The cost of living in Brazil is 0.9x lower than the national average.
The median home value in Brazil is $188,386.
The median income in Brazil is $52,055.
Brazil's Overall Cost Of Living
Lower Than The National Average
Cost Of Living In Brazil Comparison Table
| Living Expense | Brazil | Indiana | National Average |
|---|---|---|---|
| Overall | 87 | 90 | 100 |
| Services | 99 | 97 | 100 |
| Groceries | 99 | 95 | 100 |
| Health | 59 | 72 | 100 |
| Housing | 99 | 98 | 100 |
| Transportation | 98 | 94 | 100 |
| Utilities | 99 | 96 | 100 |
Source: Cost of living index, normalized to US average = 100
Brazil, IN Weather
The average high in Brazil is 63.1° and the average low is 42.6°.
There are 80.2 days of precipitation each year.
Expect an average of 43.3 inches of precipitation each year with 18.3 inches of snow.
| Stat | Brazil |
|---|---|
| Average Annual High | 63.1 |
| Average Annual Low | 42.6 |
| Annual Precipitation Days | 80.2 |
| Average Annual Precipitation | 43.3 |
| Average Annual Snowfall | 18.3 |
Average High
Days of Rain
Source: NOAA climate normals (30-year)
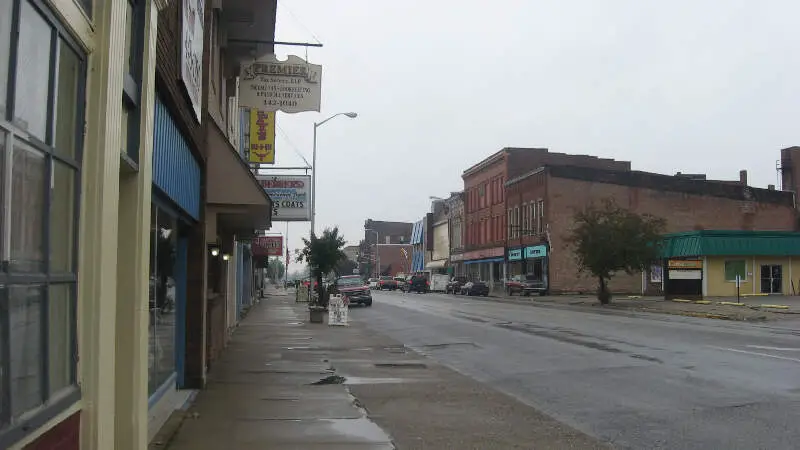
Brazil, IN Photos
Rankings & Articles For Brazil


Locations Around Brazil
Map Of Brazil, IN
Best Places Around Brazil
Paris, IL
Population 8,276
Brownsburg, IN
Population 31,215
Robinson, IL
Population 7,084
Danville, IN
Population 11,714
Bloomington, IN
Population 80,049
Bargersville, IN
Population 10,752
Ellettsville, IN
Population 6,698
Mooresville, IN
Population 9,751
Avon, IN
Population 23,437
Crawfordsville, IN
Population 16,491
Brazil Demographics And Statistics
Population over time in Brazil
The current population in Brazil is 7,831. The population has increased 4.0% from 2010.
| Year | Population | % Change |
|---|---|---|
| 2024 | 7,831 | -2.9% |
| 2023 | 8,064 | -0.6% |
| 2022 | 8,114 | -2.5% |
| 2021 | 8,320 | 1.2% |
| 2020 | 8,225 | -1.8% |
| 2019 | 8,380 | 1.1% |
| 2018 | 8,288 | -1.1% |
| 2017 | 8,384 | 3.4% |
| 2016 | 8,105 | 1.0% |
| 2015 | 8,028 | 0.1% |
| 2014 | 8,022 | -0.4% |
| 2013 | 8,055 | 3.5% |
| 2012 | 7,786 | -2.4% |
| 2011 | 7,974 | 5.9% |
| 2010 | 7,532 | - |
Race / Ethnicity in Brazil
See the full breakdown
Brazil is:
93.3% White with 7,306 White residents.
0.8% African American with 60 African American residents.
0.0% American Indian with 0 American Indian residents.
0.8% Asian with 65 Asian residents.
0.0% Hawaiian with 0 Hawaiian residents.
0.5% Other with 41 Other residents.
2.5% Two Or More with 196 Two Or More residents.
2.1% Hispanic with 163 Hispanic residents.
| Race | Brazil | IN | USA |
|---|---|---|---|
| White | 93.3% | 75.4% | 57.4% |
| African American | 0.8% | 9.1% | 11.9% |
| American Indian | 0.0% | 0.1% | 0.5% |
| Asian | 0.8% | 2.6% | 5.9% |
| Hawaiian | 0.0% | 0.0% | 0.2% |
| Other | 0.5% | 0.4% | 0.6% |
| Two Or More | 2.5% | 3.8% | 4.3% |
| Hispanic | 2.1% | 8.6% | 19.3% |
Gender in Brazil
See the full breakdown
Brazil is 53.3% female with 4,175 female residents.
Brazil is 46.7% male with 3,655 male residents.
| Gender | Brazil | IN | USA |
|---|---|---|---|
| Female | 53.3% | 50.4% | 50.5% |
| Male | 46.7% | 49.6% | 49.5% |
Highest level of educational attainment in Brazil for adults over 25
See the full breakdown
6.0% of adults in Brazil completed < 9th grade.
13.0% of adults in Brazil completed 9-12th grade.
36.0% of adults in Brazil completed high school / ged.
16.0% of adults in Brazil completed some college.
16.0% of adults in Brazil completed associate's degree.
10.0% of adults in Brazil completed bachelor's degree.
2.0% of adults in Brazil completed master's degree.
0.0% of adults in Brazil completed professional degree.
1.0% of adults in Brazil completed doctorate degree.
| Education | Brazil | IN | USA |
|---|---|---|---|
| < 9th Grade | 6.0% | 3.0% | 4.0% |
| 9-12th Grade | 13.0% | 6.0% | 6.0% |
| High School / GED | 36.0% | 33.0% | 26.0% |
| Some College | 16.0% | 19.0% | 19.0% |
| Associate's Degree | 16.0% | 9.0% | 9.0% |
| Bachelor's Degree | 10.0% | 19.0% | 22.0% |
| Master's Degree | 2.0% | 8.0% | 10.0% |
| Professional Degree | 0.0% | 2.0% | 2.0% |
| Doctorate Degree | 1.0% | 1.0% | 2.0% |
Household Income For Brazil, Indiana
See the full breakdown
7.0% of households in Brazil earn Less than $10,000.
3.6% of households in Brazil earn $10,000 to $14,999.
8.0% of households in Brazil earn $15,000 to $24,999.
15.5% of households in Brazil earn $25,000 to $34,999.
13.7% of households in Brazil earn $35,000 to $49,999.
17.4% of households in Brazil earn $50,000 to $74,999.
14.8% of households in Brazil earn $75,000 to $99,999.
11.4% of households in Brazil earn $100,000 to $149,999.
3.4% of households in Brazil earn $150,000 to $199,999.
5.1% of households in Brazil earn $200,000 or more.
| Income | Brazil | IN | USA |
|---|---|---|---|
| Less than $10,000 | 7.0% | 4.9% | 5.0% |
| $10,000 to $14,999 | 3.6% | 3.4% | 3.4% |
| $15,000 to $24,999 | 8.0% | 6.8% | 6.3% |
| $25,000 to $34,999 | 15.5% | 7.5% | 6.6% |
| $35,000 to $49,999 | 13.7% | 11.8% | 10.1% |
| $50,000 to $74,999 | 17.4% | 17.7% | 15.5% |
| $75,000 to $99,999 | 14.8% | 13.9% | 12.6% |
| $100,000 to $149,999 | 11.4% | 17.5% | 17.5% |
| $150,000 to $199,999 | 3.4% | 8.3% | 9.6% |
| $200,000 or more | 5.1% | 8.2% | 13.4% |
Source: U.S. Census ACS 5-year estimates (2024)


