Decatur SnackAbility
Overall SnackAbility
Cost of living in Decatur summary. We use data on the cost of living to determine how expensive it is to live in Decatur. Real estate prices drive most of the variance in cost of living around Indiana. Key points include:
The cost of living in Decatur is 87 with 100 being average.
The cost of living in Decatur is 0.9x lower than the national average.
The median home value in Decatur is $229,668.
The median income in Decatur is $58,646.
Decatur's Overall Cost Of Living
Lower Than The National Average
Cost Of Living In Decatur Comparison Table
| Living Expense | Decatur | Indiana | National Average |
|---|---|---|---|
| Overall | 87 | 90 | 100 |
| Services | 99 | 97 | 100 |
| Groceries | 93 | 95 | 100 |
| Health | 61 | 72 | 100 |
| Housing | 100 | 98 | 100 |
| Transportation | 95 | 94 | 100 |
| Utilities | 96 | 96 | 100 |
Source: Cost of living index, normalized to US average = 100
Decatur, IN Weather
The average high in Decatur is 60.6° and the average low is 40.9°.
There are 77.8 days of precipitation each year.
Expect an average of 38.2 inches of precipitation each year with 26.8 inches of snow.
| Stat | Decatur |
|---|---|
| Average Annual High | 60.6 |
| Average Annual Low | 40.9 |
| Annual Precipitation Days | 77.8 |
| Average Annual Precipitation | 38.2 |
| Average Annual Snowfall | 26.8 |
Average High
Days of Rain
Source: NOAA climate normals (30-year)
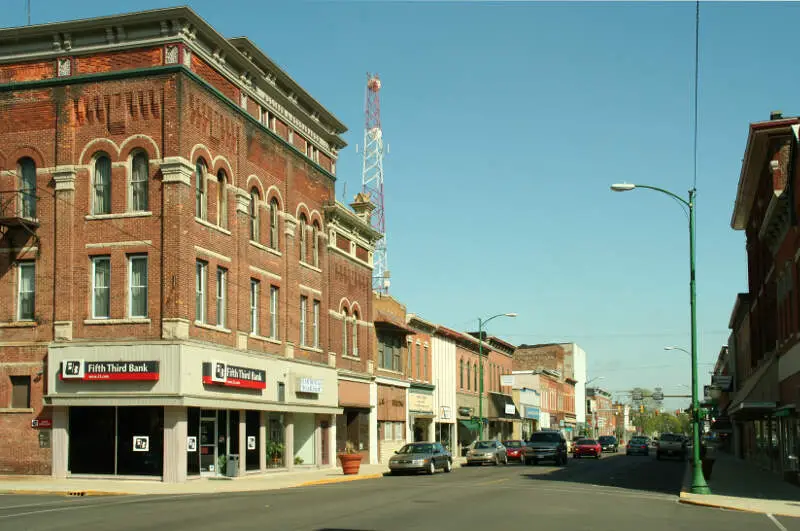
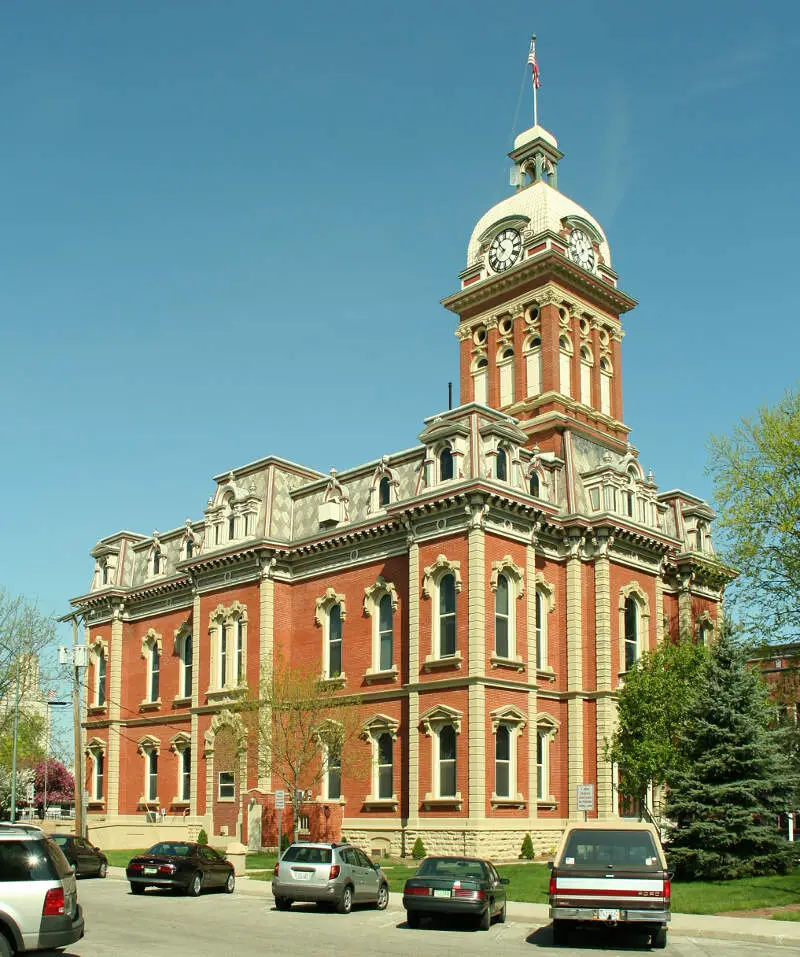
Decatur, IN Photos
Rankings & Articles For Decatur


Locations Around Decatur
Map Of Decatur, IN
Best Places Around Decatur
Oakwood, OH
Population 9,458
Wapakoneta, OH
Population 9,894
St. Marys, OH
Population 8,301
Celina, OH
Population 10,903
Union, OH
Population 7,037
Delphos, OH
Population 7,143
Defiance, OH
Population 17,276
Bryan, OH
Population 8,631
Van Wert, OH
Population 10,790
Union, KY
Population 7,642
Decatur Demographics And Statistics
Population over time in Decatur
The current population in Decatur is 9,811. The population has decreased 0.9% from 2010.
| Year | Population | % Change |
|---|---|---|
| 2024 | 9,811 | 0.4% |
| 2023 | 9,769 | 0.5% |
| 2022 | 9,718 | 0.9% |
| 2021 | 9,630 | -0.7% |
| 2020 | 9,700 | -1.7% |
| 2019 | 9,863 | -4.5% |
| 2018 | 10,331 | 8.7% |
| 2017 | 9,502 | 1.3% |
| 2016 | 9,384 | 3.3% |
| 2015 | 9,084 | -4.5% |
| 2014 | 9,511 | -3.2% |
| 2013 | 9,821 | -2.4% |
| 2012 | 10,062 | -0.6% |
| 2011 | 10,118 | 2.2% |
| 2010 | 9,901 | - |
Race / Ethnicity in Decatur
See the full breakdown
Decatur is:
87.2% White with 8,560 White residents.
0.7% African American with 68 African American residents.
0.0% American Indian with 0 American Indian residents.
0.0% Asian with 2 Asian residents.
0.0% Hawaiian with 0 Hawaiian residents.
0.2% Other with 22 Other residents.
2.1% Two Or More with 209 Two Or More residents.
9.7% Hispanic with 950 Hispanic residents.
| Race | Decatur | IN | USA |
|---|---|---|---|
| White | 87.2% | 75.4% | 57.4% |
| African American | 0.7% | 9.1% | 11.9% |
| American Indian | 0.0% | 0.1% | 0.5% |
| Asian | 0.0% | 2.6% | 5.9% |
| Hawaiian | 0.0% | 0.0% | 0.2% |
| Other | 0.2% | 0.4% | 0.6% |
| Two Or More | 2.1% | 3.8% | 4.3% |
| Hispanic | 9.7% | 8.6% | 19.3% |
Gender in Decatur
See the full breakdown
Decatur is 52.7% female with 5,174 female residents.
Decatur is 47.3% male with 4,637 male residents.
| Gender | Decatur | IN | USA |
|---|---|---|---|
| Female | 52.7% | 50.4% | 50.5% |
| Male | 47.3% | 49.6% | 49.5% |
Highest level of educational attainment in Decatur for adults over 25
See the full breakdown
2.0% of adults in Decatur completed < 9th grade.
4.0% of adults in Decatur completed 9-12th grade.
50.0% of adults in Decatur completed high school / ged.
19.0% of adults in Decatur completed some college.
13.0% of adults in Decatur completed associate's degree.
9.0% of adults in Decatur completed bachelor's degree.
3.0% of adults in Decatur completed master's degree.
0.0% of adults in Decatur completed professional degree.
0.0% of adults in Decatur completed doctorate degree.
| Education | Decatur | IN | USA |
|---|---|---|---|
| < 9th Grade | 2.0% | 3.0% | 4.0% |
| 9-12th Grade | 4.0% | 6.0% | 6.0% |
| High School / GED | 50.0% | 33.0% | 26.0% |
| Some College | 19.0% | 19.0% | 19.0% |
| Associate's Degree | 13.0% | 9.0% | 9.0% |
| Bachelor's Degree | 9.0% | 19.0% | 22.0% |
| Master's Degree | 3.0% | 8.0% | 10.0% |
| Professional Degree | 0.0% | 2.0% | 2.0% |
| Doctorate Degree | 0.0% | 1.0% | 2.0% |
Household Income For Decatur, Indiana
See the full breakdown
4.5% of households in Decatur earn Less than $10,000.
3.2% of households in Decatur earn $10,000 to $14,999.
7.5% of households in Decatur earn $15,000 to $24,999.
10.5% of households in Decatur earn $25,000 to $34,999.
18.4% of households in Decatur earn $35,000 to $49,999.
19.0% of households in Decatur earn $50,000 to $74,999.
14.7% of households in Decatur earn $75,000 to $99,999.
15.9% of households in Decatur earn $100,000 to $149,999.
4.4% of households in Decatur earn $150,000 to $199,999.
1.9% of households in Decatur earn $200,000 or more.
| Income | Decatur | IN | USA |
|---|---|---|---|
| Less than $10,000 | 4.5% | 4.9% | 5.0% |
| $10,000 to $14,999 | 3.2% | 3.4% | 3.4% |
| $15,000 to $24,999 | 7.5% | 6.8% | 6.3% |
| $25,000 to $34,999 | 10.5% | 7.5% | 6.6% |
| $35,000 to $49,999 | 18.4% | 11.8% | 10.1% |
| $50,000 to $74,999 | 19.0% | 17.7% | 15.5% |
| $75,000 to $99,999 | 14.7% | 13.9% | 12.6% |
| $100,000 to $149,999 | 15.9% | 17.5% | 17.5% |
| $150,000 to $199,999 | 4.4% | 8.3% | 9.6% |
| $200,000 or more | 1.9% | 8.2% | 13.4% |
Source: U.S. Census ACS 5-year estimates (2024)


