Union, KY
Demographics And Statistics
Living In Union, Kentucky Summary
Life in Union research summary. HomeSnacks has been using Saturday Night Science to research the quality of life in Union over the past nine years using Census, FBI, Zillow, and other primary data sources. Based on the most recently available data, we found the following about life in Union:
The population in Union is 7,494.
The median home value in Union is $444,406.
The median income in Union is $139,013.
The cost of living in Union is 121 which is 1.2x higher than the national average.
The median rent in Union is $1,721.
The unemployment rate in Union is 0.8%.
The poverty rate in Union is 3.3%.
The average high in Union is 63.9° and the average low is 44.6°.
Table Of Contents
Union SnackAbility
Overall SnackAbility
Union, KY Cost Of Living
Cost of living in Union summary. We use data on the cost of living to determine how expensive it is to live in Union. Real estate prices drive most of the variance in cost of living around Kentucky. Key points include:
The cost of living in Union is 121 with 100 being average.
The cost of living in Union is 1.2x higher than the national average.
The median home value in Union is $444,406.
The median income in Union is $139,013.
Union's Overall Cost Of Living
Higher Than The National Average
Cost Of Living In Union Comparison Table
| Living Expense | Union | Kentucky | National Average | |
|---|---|---|---|---|
| Overall | 121 | 92 | 100 | |
| Services | 104 | 101 | 100 | |
| Groceries | 101 | 99 | 100 | |
| Health | 104 | 85 | 100 | |
| Housing | 161 | 71 | 100 | |
| Transportation | 103 | 94 | 100 | |
| Utilities | 101 | 105 | 100 | |
Union, KY Weather
The average high in Union is 63.9° and the average low is 44.6°.
There are 69.5 days of precipitation each year.
Expect an average of 42.2 inches of precipitation each year with 18.2 inches of snow.
| Stat | Union |
|---|---|
| Average Annual High | 63.9 |
| Average Annual Low | 44.6 |
| Annual Precipitation Days | 69.5 |
| Average Annual Precipitation | 42.2 |
| Average Annual Snowfall | 18.2 |
Average High
Days of Rain
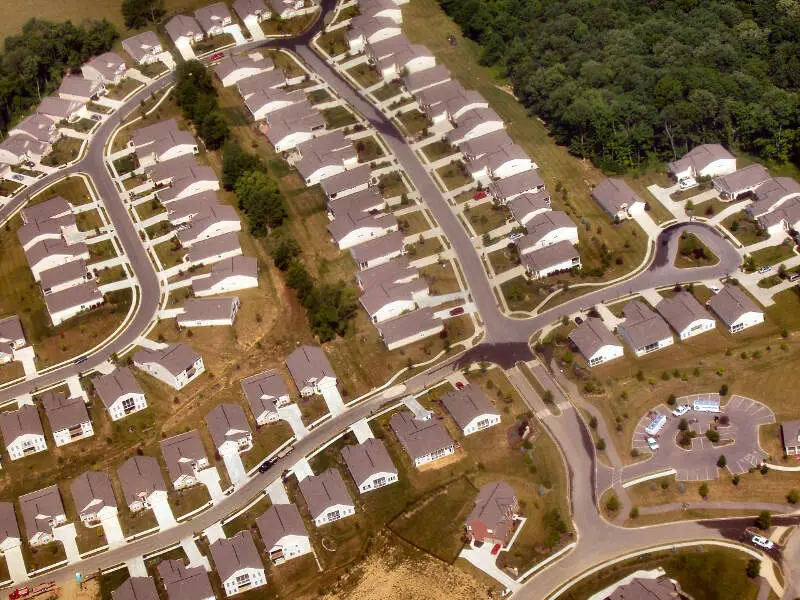
Union, KY Photos
Rankings for Union in Kentucky


Locations Around Union
Map Of Union, KY
Best Places Around Union
Oakwood, OH
Population 9,480
Kettering, OH
Population 57,442
Germantown, OH
Population 5,796
Wapakoneta, OH
Population 9,867
Clayton, OH
Population 13,269
Oxford, OH
Population 22,069
St. Marys, OH
Population 8,319
Vandalia, OH
Population 15,100
Celina, OH
Population 11,017
Brookville, OH
Population 6,234
Union Demographics And Statistics
Population over time in Union
The current population in Union is 7,494. The population has increased 49.3% from 2010.
| Year | Population | % Change |
|---|---|---|
| 2023 | 7,494 | 1.7% |
| 2022 | 7,369 | 2.0% |
| 2021 | 7,227 | 20.7% |
| 2020 | 5,988 | 1.3% |
| 2019 | 5,910 | 1.6% |
| 2018 | 5,815 | 1.1% |
| 2017 | 5,751 | 1.3% |
| 2016 | 5,677 | 0.7% |
| 2015 | 5,635 | 1.2% |
| 2014 | 5,569 | 1.7% |
| 2013 | 5,477 | 2.2% |
| 2012 | 5,357 | 2.7% |
| 2011 | 5,217 | 4.0% |
| 2010 | 5,018 | - |
Race / Ethnicity in Union
Union is:
92.0% White with 6,894 White residents.
0.0% African American with 0 African American residents.
0.0% American Indian with 0 American Indian residents.
1.4% Asian with 103 Asian residents.
0.0% Hawaiian with 0 Hawaiian residents.
0.0% Other with 0 Other residents.
4.5% Two Or More with 335 Two Or More residents.
2.2% Hispanic with 162 Hispanic residents.
| Race | Union | KY | USA |
|---|---|---|---|
| White | 92.0% | 82.3% | 58.2% |
| African American | 0.0% | 7.8% | 12.0% |
| American Indian | 0.0% | 0.1% | 0.5% |
| Asian | 1.4% | 1.5% | 5.7% |
| Hawaiian | 0.0% | 0.1% | 0.2% |
| Other | 0.0% | 0.3% | 0.5% |
| Two Or More | 4.5% | 3.3% | 3.9% |
| Hispanic | 2.2% | 4.7% | 19.0% |
Gender in Union
Union is 48.7% female with 3,652 female residents.
Union is 51.3% male with 3,842 male residents.
| Gender | Union | KY | USA |
|---|---|---|---|
| Female | 48.7% | 50.5% | 50.5% |
| Male | 51.3% | 49.5% | 49.5% |
Highest level of educational attainment in Union for adults over 25
-0.0% of adults in Union completed < 9th grade.
1.0% of adults in Union completed 9-12th grade.
20.0% of adults in Union completed high school / ged.
12.0% of adults in Union completed some college.
8.0% of adults in Union completed associate's degree.
33.0% of adults in Union completed bachelor's degree.
19.0% of adults in Union completed master's degree.
2.0% of adults in Union completed professional degree.
5.0% of adults in Union completed doctorate degree.
| Education | Union | KY | USA |
|---|---|---|---|
| < 9th Grade | -0.0% | 4.0% | 5.0% |
| 9-12th Grade | 1.0% | 7.0% | 6.0% |
| High School / GED | 20.0% | 33.0% | 26.0% |
| Some College | 12.0% | 20.0% | 19.0% |
| Associate's Degree | 8.0% | 9.0% | 9.0% |
| Bachelor's Degree | 33.0% | 16.0% | 21.0% |
| Master's Degree | 19.0% | 8.0% | 10.0% |
| Professional Degree | 2.0% | 2.0% | 2.0% |
| Doctorate Degree | 5.0% | 1.0% | 2.0% |
Household Income For Union, Kentucky
1.0% of households in Union earn Less than $10,000.
1.1% of households in Union earn $10,000 to $14,999.
1.5% of households in Union earn $15,000 to $24,999.
0.7% of households in Union earn $25,000 to $34,999.
4.1% of households in Union earn $35,000 to $49,999.
4.9% of households in Union earn $50,000 to $74,999.
13.1% of households in Union earn $75,000 to $99,999.
32.6% of households in Union earn $100,000 to $149,999.
19.2% of households in Union earn $150,000 to $199,999.
21.7% of households in Union earn $200,000 or more.
| Income | Union | KY | USA |
|---|---|---|---|
| Less than $10,000 | 1.0% | 6.0% | 4.9% |
| $10,000 to $14,999 | 1.1% | 5.4% | 3.6% |
| $15,000 to $24,999 | 1.5% | 8.5% | 6.6% |
| $25,000 to $34,999 | 0.7% | 8.6% | 6.8% |
| $35,000 to $49,999 | 4.1% | 12.5% | 10.4% |
| $50,000 to $74,999 | 4.9% | 17.1% | 15.7% |
| $75,000 to $99,999 | 13.1% | 12.9% | 12.7% |
| $100,000 to $149,999 | 32.6% | 15.8% | 17.4% |
| $150,000 to $199,999 | 19.2% | 6.7% | 9.3% |
| $200,000 or more | 21.7% | 6.7% | 12.6% |


