Compare Evansville to…
Evansville SnackAbility
Overall SnackAbility
Crime in Evansville summary. We use data from the FBI to determine the crime rates in Evansville. Key points include:
There were 5,601 total crimes in Evansville in the last reporting year.
The overall crime rate per 100,000 people in Evansville is 4,884.9 / 100k people.
The violent crime rate per 100,000 people in Evansville is 1,206.2 / 100k people.
The property crime rate per 100,000 people in Evansville is 3,678.7 / 100k people.
Overall, crime in Evansville is 130.50% above the national average.
Total Crimes
Above National Average
Crime In Evansville Comparison Table
| Statistic | Count Raw |
Evansville / 100k People |
Indiana / 100k People |
National / 100k People |
|---|---|---|---|---|
| Total Crimes Per 100K | 5,601 | 4,884.9 | 1,691.5 | 2,119.2 |
| Violent Crime | 1,383 | 1,206.2 | 312.9 | 359.0 |
| Murder | 12 | 10.5 | 5.5 | 5.0 |
| Robbery | 65 | 56.7 | 34.5 | 61.0 |
| Aggravated Assault | 1,207 | 1,052.7 | 239.4 | 256.0 |
| Property Crime | 4,218 | 3,678.7 | 1,378.6 | 1,760.0 |
| Burglary | 590 | 514.6 | 176.8 | 229.0 |
| Larceny | 3,235 | 2,821.4 | 988.8 | 1,272.0 |
| Car Theft | 393 | 342.8 | 213.0 | 259.0 |
Source: FBI Uniform Crime Reporting (2024)
Cost of living in Evansville summary. We use data on the cost of living to determine how expensive it is to live in Evansville. Real estate prices drive most of the variance in cost of living around Indiana. Key points include:
The cost of living in Evansville is 88 with 100 being average.
The cost of living in Evansville is 0.9x lower than the national average.
The median home value in Evansville is $198,977.
The median income in Evansville is $53,387.
Evansville's Overall Cost Of Living
Lower Than The National Average
Cost Of Living In Evansville Comparison Table
| Living Expense | Evansville | Indiana | National Average |
|---|---|---|---|
| Overall | 88 | 90 | 100 |
| Services | 98 | 97 | 100 |
| Groceries | 93 | 95 | 100 |
| Health | 65 | 72 | 100 |
| Housing | 95 | 98 | 100 |
| Transportation | 95 | 94 | 100 |
| Utilities | 100 | 96 | 100 |
Source: Cost of living index, normalized to US average = 100
Evansville, IN Weather
The average high in Evansville is 66.9° and the average low is 46.9°.
There are 75.1 days of precipitation each year.
Expect an average of 45.9 inches of precipitation each year with 11.2 inches of snow.
| Stat | Evansville |
|---|---|
| Average Annual High | 66.9 |
| Average Annual Low | 46.9 |
| Annual Precipitation Days | 75.1 |
| Average Annual Precipitation | 45.9 |
| Average Annual Snowfall | 11.2 |
Average High
Days of Rain
Source: NOAA climate normals (30-year)
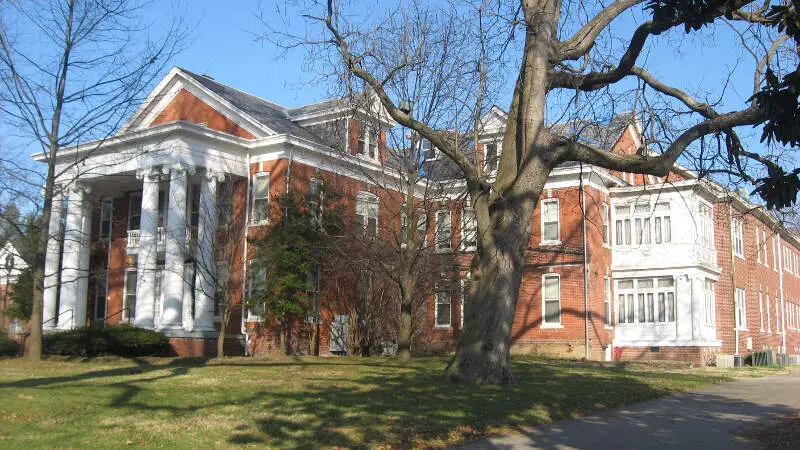
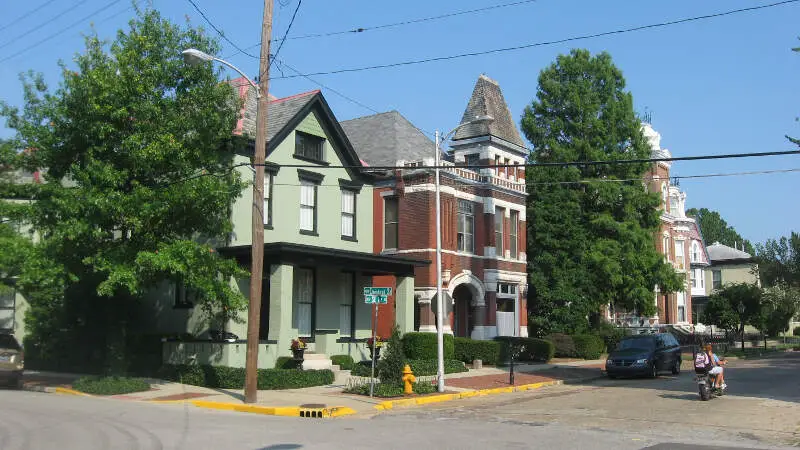
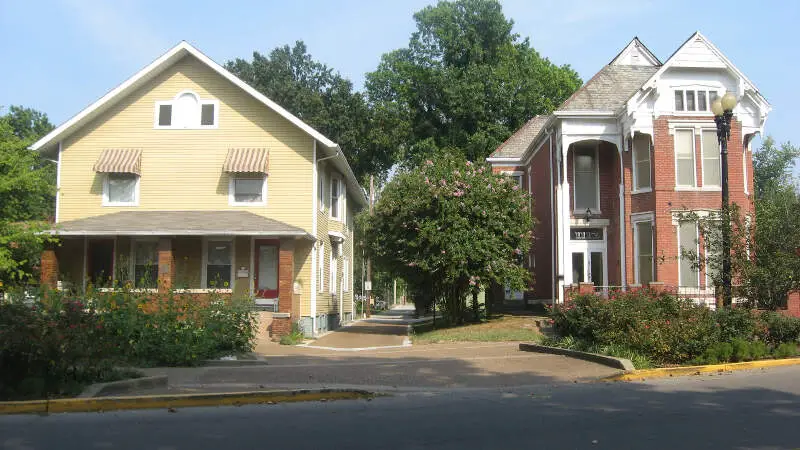
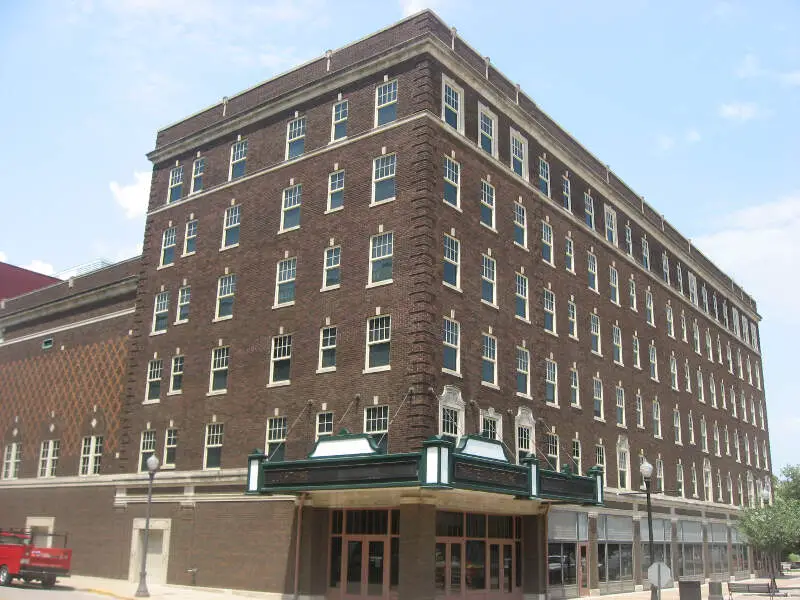
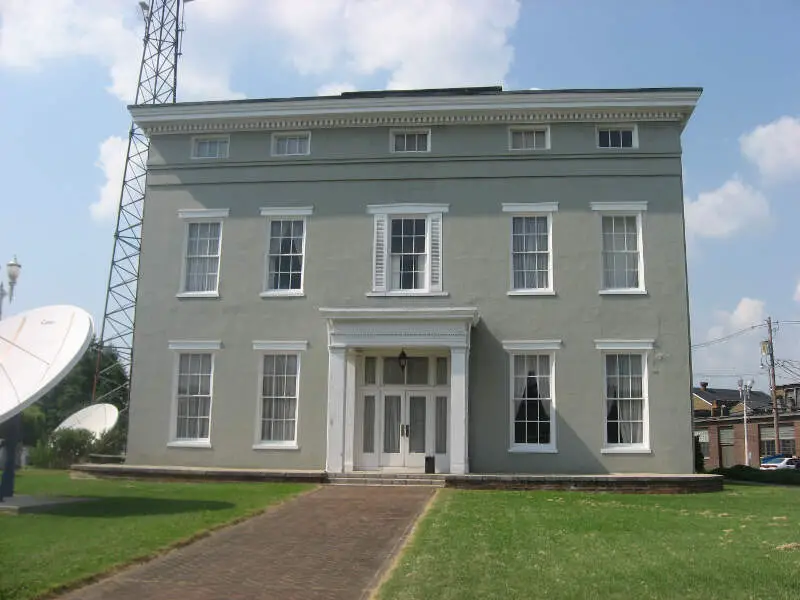
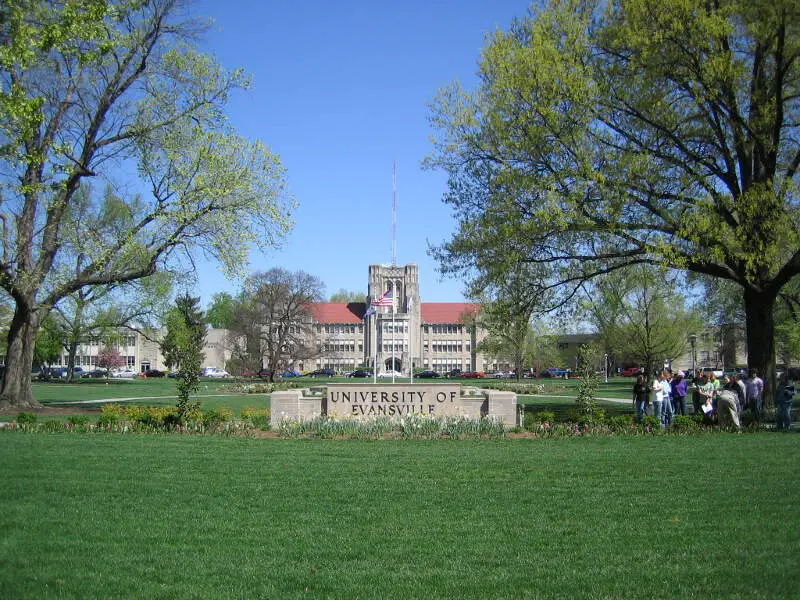
Evansville, IN Photos


1 Reviews & Comments About Evansville

I live in Evansville, but we aren't surrounded by drunks, just idiot drivers.
Rankings & Articles For Evansville


Locations Around Evansville
Map Of Evansville, IN
Best Places Around Evansville
Carmi, IL
Population 4,845
Mount Carmel, IL
Population 6,854
Owensboro, KY
Population 60,302
Jasper, IN
Population 15,991
Mount Vernon, IN
Population 6,400
Huntingburg, IN
Population 6,396
Morganfield, KY
Population 3,185
Madisonville, KY
Population 19,515
Henderson, KY
Population 27,852
Vincennes, IN
Population 16,586
Evansville Demographics And Statistics
Population over time in Evansville
The current population in Evansville is 116,116. The population has decreased 1.8% from 2010.
| Year | Population | % Change |
|---|---|---|
| 2024 | 116,116 | -0.3% |
| 2023 | 116,441 | -0.4% |
| 2022 | 116,906 | -0.2% |
| 2021 | 117,184 | -1.0% |
| 2020 | 118,414 | -0.1% |
| 2019 | 118,588 | -0.3% |
| 2018 | 118,952 | -0.7% |
| 2017 | 119,806 | -0.3% |
| 2016 | 120,156 | -0.0% |
| 2015 | 120,212 | -0.0% |
| 2014 | 120,220 | 0.5% |
| 2013 | 119,677 | 0.4% |
| 2012 | 119,226 | 1.1% |
| 2011 | 117,942 | -0.2% |
| 2010 | 118,186 | - |
Race / Ethnicity in Evansville
See the full breakdown
Evansville is:
75.6% White with 87,788 White residents.
11.7% African American with 13,643 African American residents.
0.0% American Indian with 58 American Indian residents.
1.0% Asian with 1,211 Asian residents.
0.5% Hawaiian with 548 Hawaiian residents.
0.9% Other with 1,022 Other residents.
6.2% Two Or More with 7,179 Two Or More residents.
4.0% Hispanic with 4,667 Hispanic residents.
| Race | Evansville | IN | USA |
|---|---|---|---|
| White | 75.6% | 75.4% | 57.4% |
| African American | 11.7% | 9.1% | 11.9% |
| American Indian | 0.0% | 0.1% | 0.5% |
| Asian | 1.0% | 2.6% | 5.9% |
| Hawaiian | 0.5% | 0.0% | 0.2% |
| Other | 0.9% | 0.4% | 0.6% |
| Two Or More | 6.2% | 3.8% | 4.3% |
| Hispanic | 4.0% | 8.6% | 19.3% |
Gender in Evansville
See the full breakdown
Evansville is 51.0% female with 59,213 female residents.
Evansville is 49.0% male with 56,902 male residents.
| Gender | Evansville | IN | USA |
|---|---|---|---|
| Female | 51.0% | 50.4% | 50.5% |
| Male | 49.0% | 49.6% | 49.5% |
Highest level of educational attainment in Evansville for adults over 25
See the full breakdown
3.0% of adults in Evansville completed < 9th grade.
7.0% of adults in Evansville completed 9-12th grade.
34.0% of adults in Evansville completed high school / ged.
22.0% of adults in Evansville completed some college.
11.0% of adults in Evansville completed associate's degree.
16.0% of adults in Evansville completed bachelor's degree.
5.0% of adults in Evansville completed master's degree.
1.0% of adults in Evansville completed professional degree.
1.0% of adults in Evansville completed doctorate degree.
| Education | Evansville | IN | USA |
|---|---|---|---|
| < 9th Grade | 3.0% | 3.0% | 4.0% |
| 9-12th Grade | 7.0% | 6.0% | 6.0% |
| High School / GED | 34.0% | 33.0% | 26.0% |
| Some College | 22.0% | 19.0% | 19.0% |
| Associate's Degree | 11.0% | 9.0% | 9.0% |
| Bachelor's Degree | 16.0% | 19.0% | 22.0% |
| Master's Degree | 5.0% | 8.0% | 10.0% |
| Professional Degree | 1.0% | 2.0% | 2.0% |
| Doctorate Degree | 1.0% | 1.0% | 2.0% |
Household Income For Evansville, Indiana
See the full breakdown
6.4% of households in Evansville earn Less than $10,000.
5.3% of households in Evansville earn $10,000 to $14,999.
8.0% of households in Evansville earn $15,000 to $24,999.
10.7% of households in Evansville earn $25,000 to $34,999.
16.1% of households in Evansville earn $35,000 to $49,999.
21.7% of households in Evansville earn $50,000 to $74,999.
12.7% of households in Evansville earn $75,000 to $99,999.
12.2% of households in Evansville earn $100,000 to $149,999.
3.5% of households in Evansville earn $150,000 to $199,999.
3.4% of households in Evansville earn $200,000 or more.
| Income | Evansville | IN | USA |
|---|---|---|---|
| Less than $10,000 | 6.4% | 4.9% | 5.0% |
| $10,000 to $14,999 | 5.3% | 3.4% | 3.4% |
| $15,000 to $24,999 | 8.0% | 6.8% | 6.3% |
| $25,000 to $34,999 | 10.7% | 7.5% | 6.6% |
| $35,000 to $49,999 | 16.1% | 11.8% | 10.1% |
| $50,000 to $74,999 | 21.7% | 17.7% | 15.5% |
| $75,000 to $99,999 | 12.7% | 13.9% | 12.6% |
| $100,000 to $149,999 | 12.2% | 17.5% | 17.5% |
| $150,000 to $199,999 | 3.5% | 8.3% | 9.6% |
| $200,000 or more | 3.4% | 8.2% | 13.4% |
Source: U.S. Census ACS 5-year estimates (2024)


