Owensboro, KY
Demographics And Statistics
Living In Owensboro, Kentucky Summary
Life in Owensboro research summary. HomeSnacks has been using Saturday Night Science to research the quality of life in Owensboro over the past nine years using Census, FBI, Zillow, and other primary data sources. Based on the most recently available data, we found the following about life in Owensboro:
The population in Owensboro is 60,112.
The median home value in Owensboro is $202,025.
The median income in Owensboro is $53,295.
The cost of living in Owensboro is 94 which is 0.9x lower than the national average.
The median rent in Owensboro is $900.
The unemployment rate in Owensboro is 4.8%.
The poverty rate in Owensboro is 19.9%.
The average high in Owensboro is 67.3° and the average low is 46.5°.
Owensboro SnackAbility
Overall SnackAbility
Owensboro, KY Crime Report
Crime in Owensboro summary. We use data from the FBI to determine the crime rates in Owensboro. Key points include:
There were 1,963 total crimes in Owensboro in the last reporting year.
The overall crime rate per 100,000 people in Owensboro is 3,266.4 / 100k people.
The violent crime rate per 100,000 people in Owensboro is 349.4 / 100k people.
The property crime rate per 100,000 people in Owensboro is 2,917.0 / 100k people.
Overall, crime in Owensboro is 54.13% above the national average.
Total Crimes
Above National Average
Crime In Owensboro Comparison Table
| Statistic | Count Raw |
Owensboro / 100k People |
Kentucky / 100k People |
National / 100k People |
|---|---|---|---|---|
| Total Crimes Per 100K | 1,963 | 3,266.4 | 1,563.0 | 2,119.2 |
| Violent Crime | 210 | 349.4 | 213.1 | 359.0 |
| Murder | 1 | 1.7 | 6.1 | 5.0 |
| Robbery | 27 | 44.9 | 35.1 | 61.0 |
| Aggravated Assault | 135 | 224.6 | 139.5 | 256.0 |
| Property Crime | 1,753 | 2,917.0 | 1,349.9 | 1,760.0 |
| Burglary | 203 | 337.8 | 193.6 | 229.0 |
| Larceny | 1,357 | 2,258.1 | 930.2 | 1,272.0 |
| Car Theft | 193 | 321.2 | 226.2 | 259.0 |
Owensboro, KY Cost Of Living
Cost of living in Owensboro summary. We use data on the cost of living to determine how expensive it is to live in Owensboro. Real estate prices drive most of the variance in cost of living around Kentucky. Key points include:
The cost of living in Owensboro is 94 with 100 being average.
The cost of living in Owensboro is 0.9x lower than the national average.
The median home value in Owensboro is $202,025.
The median income in Owensboro is $53,295.
Owensboro's Overall Cost Of Living
Lower Than The National Average
Cost Of Living In Owensboro Comparison Table
| Living Expense | Owensboro | Kentucky | National Average | |
|---|---|---|---|---|
| Overall | 94 | 92 | 100 | |
| Services | 101 | 101 | 100 | |
| Groceries | 96 | 99 | 100 | |
| Health | 89 | 85 | 100 | |
| Housing | 75 | 71 | 100 | |
| Transportation | 91 | 94 | 100 | |
| Utilities | 123 | 105 | 100 | |
Owensboro, KY Weather
The average high in Owensboro is 67.3° and the average low is 46.5°.
There are 71.9 days of precipitation each year.
Expect an average of 46.4 inches of precipitation each year with 7.1 inches of snow.
| Stat | Owensboro |
|---|---|
| Average Annual High | 67.3 |
| Average Annual Low | 46.5 |
| Annual Precipitation Days | 71.9 |
| Average Annual Precipitation | 46.4 |
| Average Annual Snowfall | 7.1 |
Average High
Days of Rain
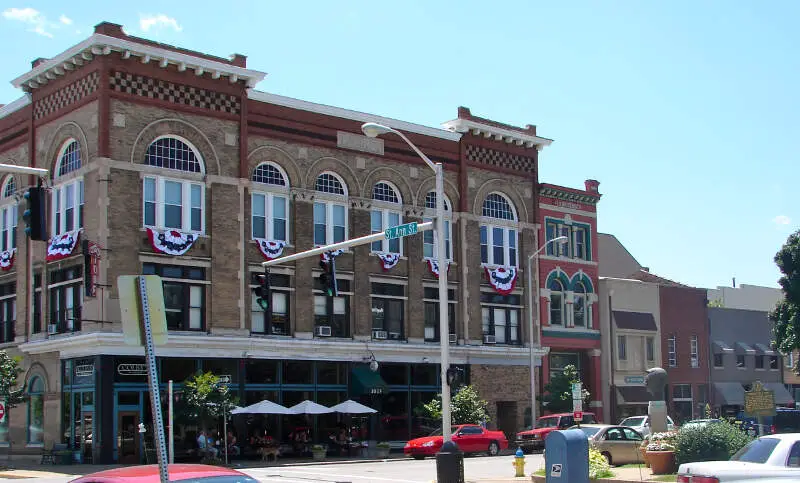
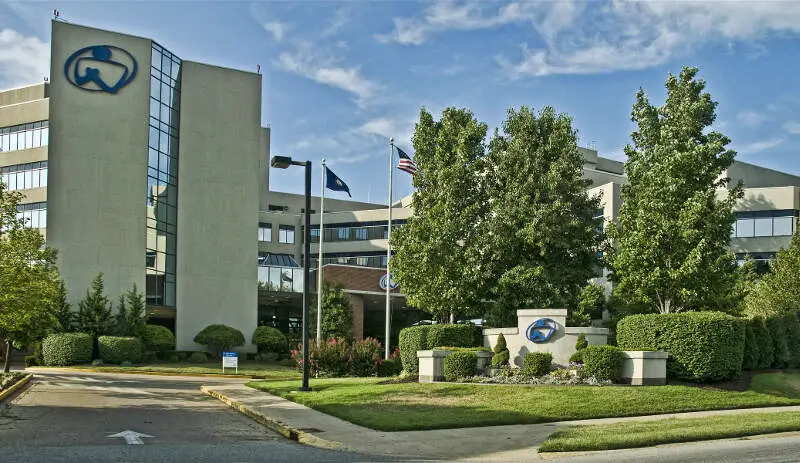
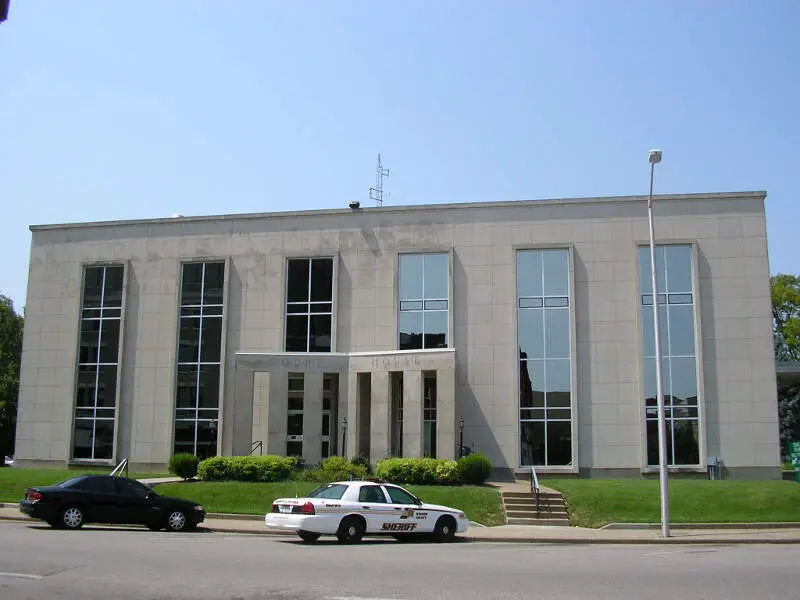
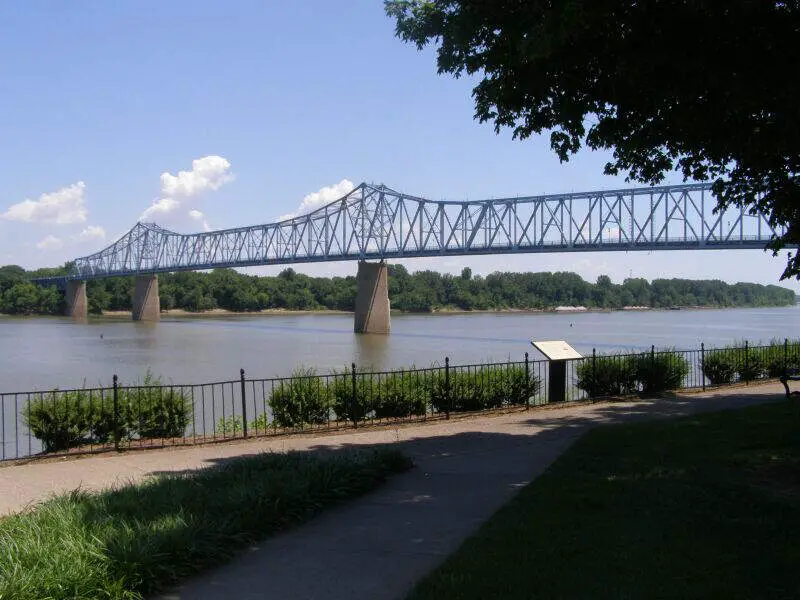
Owensboro, KY Photos


2 Reviews & Comments About Owensboro
/5

B.I.G CAM - None
I live in Owensboro and we actually have probably one of the nicest city's in Kentucky so I'm glad we weren't on here
HomeSnacks User - None
I Live in Owensboro and it is one of the most fd yo cities its also one of the biggest cities in ky mfs stay getting.l robbed shot raped stabbed etc.. those small towns u listed are candy lands compared to Louisville or Owensboro or Lexington Paducah bowlinggreen hopkinsville Madisonville Henderson
Rankings for Owensboro in Kentucky


Locations Around Owensboro
Map Of Owensboro, KY
Best Places Around Owensboro
Jasper, IN
Population 16,421
Mount Vernon, IN
Population 6,431
Huntingburg, IN
Population 6,504
Morganfield, KY
Population 3,208
Madisonville, KY
Population 19,442
Central, LA
Population 29,603
Greenville, KY
Population 4,435
Henderson, KY
Population 27,994
Boonville, IN
Population 6,681
Owensboro Demographics And Statistics
Population over time in Owensboro
The current population in Owensboro is 60,112. The population has increased 6.3% from 2010.
| Year | Population | % Change |
|---|---|---|
| 2023 | 60,112 | 0.2% |
| 2022 | 60,019 | 0.3% |
| 2021 | 59,839 | 0.1% |
| 2020 | 59,796 | 0.4% |
| 2019 | 59,536 | 0.6% |
| 2018 | 59,188 | 0.7% |
| 2017 | 58,791 | 0.2% |
| 2016 | 58,685 | 0.6% |
| 2015 | 58,350 | 0.6% |
| 2014 | 58,000 | 0.4% |
| 2013 | 57,763 | 0.7% |
| 2012 | 57,361 | 0.8% |
| 2011 | 56,928 | 0.7% |
| 2010 | 56,541 | - |
Race / Ethnicity in Owensboro
Owensboro is:
80.2% White with 48,191 White residents.
6.4% African American with 3,856 African American residents.
0.2% American Indian with 132 American Indian residents.
3.1% Asian with 1,863 Asian residents.
0.0% Hawaiian with 10 Hawaiian residents.
1.1% Other with 658 Other residents.
3.6% Two Or More with 2,153 Two Or More residents.
5.4% Hispanic with 3,249 Hispanic residents.
| Race | Owensboro | KY | USA |
|---|---|---|---|
| White | 80.2% | 82.3% | 58.2% |
| African American | 6.4% | 7.8% | 12.0% |
| American Indian | 0.2% | 0.1% | 0.5% |
| Asian | 3.1% | 1.5% | 5.7% |
| Hawaiian | 0.0% | 0.1% | 0.2% |
| Other | 1.1% | 0.3% | 0.5% |
| Two Or More | 3.6% | 3.3% | 3.9% |
| Hispanic | 5.4% | 4.7% | 19.0% |
Gender in Owensboro
Owensboro is 51.0% female with 30,632 female residents.
Owensboro is 49.0% male with 29,479 male residents.
| Gender | Owensboro | KY | USA |
|---|---|---|---|
| Female | 51.0% | 50.5% | 50.5% |
| Male | 49.0% | 49.5% | 49.5% |
Highest level of educational attainment in Owensboro for adults over 25
3.0% of adults in Owensboro completed < 9th grade.
6.0% of adults in Owensboro completed 9-12th grade.
35.0% of adults in Owensboro completed high school / ged.
20.0% of adults in Owensboro completed some college.
10.0% of adults in Owensboro completed associate's degree.
15.0% of adults in Owensboro completed bachelor's degree.
8.0% of adults in Owensboro completed master's degree.
2.0% of adults in Owensboro completed professional degree.
1.0% of adults in Owensboro completed doctorate degree.
| Education | Owensboro | KY | USA |
|---|---|---|---|
| < 9th Grade | 3.0% | 4.0% | 5.0% |
| 9-12th Grade | 6.0% | 7.0% | 6.0% |
| High School / GED | 35.0% | 33.0% | 26.0% |
| Some College | 20.0% | 20.0% | 19.0% |
| Associate's Degree | 10.0% | 9.0% | 9.0% |
| Bachelor's Degree | 15.0% | 16.0% | 21.0% |
| Master's Degree | 8.0% | 8.0% | 10.0% |
| Professional Degree | 2.0% | 2.0% | 2.0% |
| Doctorate Degree | 1.0% | 1.0% | 2.0% |
Household Income For Owensboro, Kentucky
8.1% of households in Owensboro earn Less than $10,000.
5.9% of households in Owensboro earn $10,000 to $14,999.
9.7% of households in Owensboro earn $15,000 to $24,999.
8.7% of households in Owensboro earn $25,000 to $34,999.
14.5% of households in Owensboro earn $35,000 to $49,999.
18.5% of households in Owensboro earn $50,000 to $74,999.
10.8% of households in Owensboro earn $75,000 to $99,999.
13.5% of households in Owensboro earn $100,000 to $149,999.
6.0% of households in Owensboro earn $150,000 to $199,999.
4.4% of households in Owensboro earn $200,000 or more.
| Income | Owensboro | KY | USA |
|---|---|---|---|
| Less than $10,000 | 8.1% | 6.0% | 4.9% |
| $10,000 to $14,999 | 5.9% | 5.4% | 3.6% |
| $15,000 to $24,999 | 9.7% | 8.5% | 6.6% |
| $25,000 to $34,999 | 8.7% | 8.6% | 6.8% |
| $35,000 to $49,999 | 14.5% | 12.5% | 10.4% |
| $50,000 to $74,999 | 18.5% | 17.1% | 15.7% |
| $75,000 to $99,999 | 10.8% | 12.9% | 12.7% |
| $100,000 to $149,999 | 13.5% | 15.8% | 17.4% |
| $150,000 to $199,999 | 6.0% | 6.7% | 9.3% |
| $200,000 or more | 4.4% | 6.7% | 12.6% |


