Gary SnackAbility
Overall SnackAbility
Crime in Gary summary. We use data from the FBI to determine the crime rates in Gary. Key points include:
There were 2,514 total crimes in Gary in the last reporting year.
The overall crime rate per 100,000 people in Gary is 3,726.5 / 100k people.
The violent crime rate per 100,000 people in Gary is 898.3 / 100k people.
The property crime rate per 100,000 people in Gary is 2,828.2 / 100k people.
Overall, crime in Gary is 75.84% above the national average.
Total Crimes
Above National Average
Crime In Gary Comparison Table
| Statistic | Count Raw |
Gary / 100k People |
Indiana / 100k People |
National / 100k People |
|---|---|---|---|---|
| Total Crimes Per 100K | 2,514 | 3,726.5 | 1,691.5 | 2,119.2 |
| Violent Crime | 606 | 898.3 | 312.9 | 359.0 |
| Murder | 47 | 69.7 | 5.5 | 5.0 |
| Robbery | 74 | 109.7 | 34.5 | 61.0 |
| Aggravated Assault | 447 | 662.6 | 239.4 | 256.0 |
| Property Crime | 1,908 | 2,828.2 | 1,378.6 | 1,760.0 |
| Burglary | 374 | 554.4 | 176.8 | 229.0 |
| Larceny | 986 | 1,461.5 | 988.8 | 1,272.0 |
| Car Theft | 548 | 812.3 | 213.0 | 259.0 |
Source: FBI Uniform Crime Reporting (2024)
Cost of living in Gary summary. We use data on the cost of living to determine how expensive it is to live in Gary. Real estate prices drive most of the variance in cost of living around Indiana. Key points include:
The cost of living in Gary is 81 with 100 being average.
The cost of living in Gary is 0.8x lower than the national average.
The median home value in Gary is $86,989.
The median income in Gary is $38,731.
Gary's Overall Cost Of Living
Lower Than The National Average
Cost Of Living In Gary Comparison Table
| Living Expense | Gary | Indiana | National Average |
|---|---|---|---|
| Overall | 81 | 90 | 100 |
| Services | 92 | 97 | 100 |
| Groceries | 99 | 95 | 100 |
| Health | 51 | 72 | 100 |
| Housing | 92 | 98 | 100 |
| Transportation | 97 | 94 | 100 |
| Utilities | 92 | 96 | 100 |
Source: Cost of living index, normalized to US average = 100
Gary, IN Weather
The average high in Gary is 59.7° and the average low is 42.3°.
There are 74.7 days of precipitation each year.
Expect an average of 38.1 inches of precipitation each year with 35.8 inches of snow.
| Stat | Gary |
|---|---|
| Average Annual High | 59.7 |
| Average Annual Low | 42.3 |
| Annual Precipitation Days | 74.7 |
| Average Annual Precipitation | 38.1 |
| Average Annual Snowfall | 35.8 |
Average High
Days of Rain
Source: NOAA climate normals (30-year)
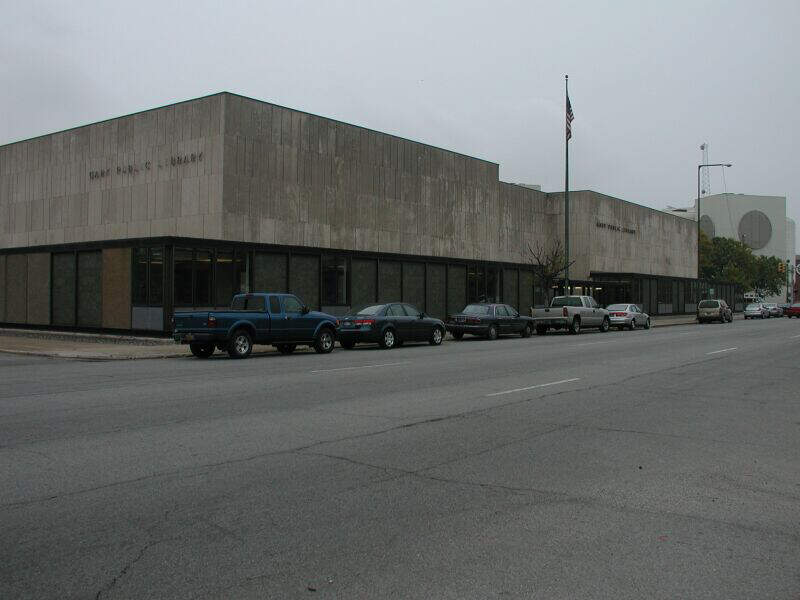
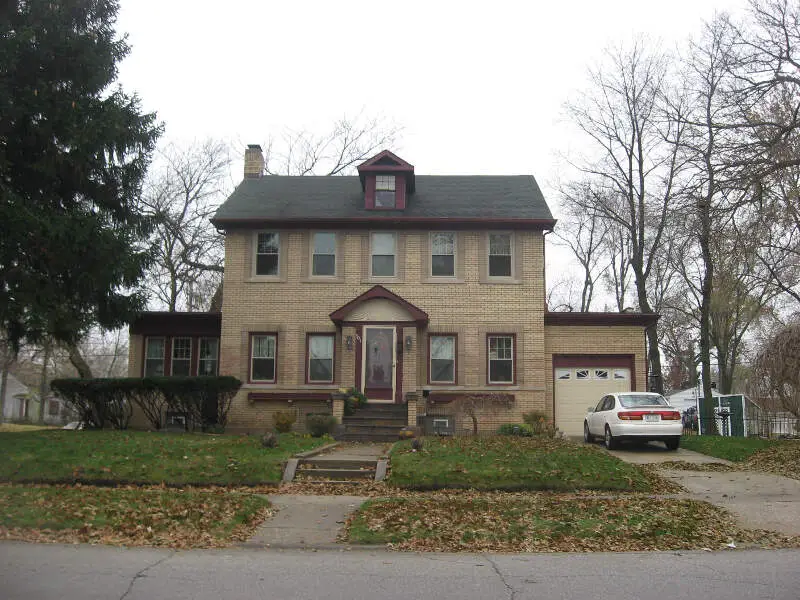
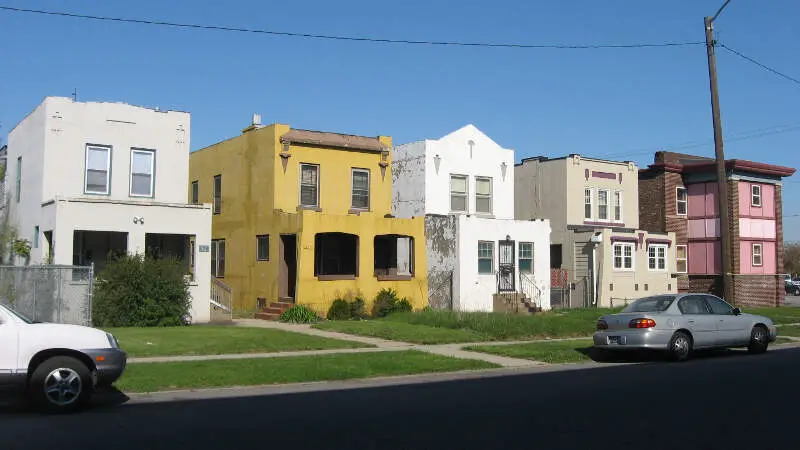
Gary, IN Photos


2 Reviews & Comments About Gary

So I'mma just say I live in indi and I've heard Gary is the worst place to live if its night and you call the police they most likely won't come
Gary is famous for its terrible crime and the destruction of the city. But I still have a soft spot in my heart about it because I grew up there
Back in the day, it was a friendly and vibrant town. Nowadays, people are afraid to go there and the population is shrinking.
Rankings & Articles For Gary


Locations Around Gary
Map Of Gary, IN
Best Places Around Gary
Flossmoor, IL
Population 9,391
Homewood, IL
Population 19,294
Midlothian, IL
Population 13,948
South Holland, IL
Population 20,911
Glenwood, IL
Population 8,603
Country Club Hills, IL
Population 16,324
Lansing, IL
Population 28,284
Lynwood, IL
Population 9,083
Calumet Park, IL
Population 6,855
Hazel Crest, IL
Population 13,792
Gary Demographics And Statistics
Population over time in Gary
The current population in Gary is 68,113. The population has decreased 19.3% from 2010.
| Year | Population | % Change |
|---|---|---|
| 2024 | 68,113 | -0.7% |
| 2023 | 68,604 | -0.8% |
| 2022 | 69,136 | -0.9% |
| 2021 | 69,739 | -7.6% |
| 2020 | 75,486 | -0.7% |
| 2019 | 76,010 | -0.9% |
| 2018 | 76,677 | -1.0% |
| 2017 | 77,416 | -0.6% |
| 2016 | 77,858 | -0.8% |
| 2015 | 78,483 | -0.9% |
| 2014 | 79,165 | -0.9% |
| 2013 | 79,922 | -1.5% |
| 2012 | 81,153 | -2.0% |
| 2011 | 82,797 | -1.9% |
| 2010 | 84,407 | - |
Race / Ethnicity in Gary
See the full breakdown
Gary is:
9.4% White with 6,421 White residents.
75.7% African American with 51,585 African American residents.
0.1% American Indian with 59 American Indian residents.
0.4% Asian with 240 Asian residents.
0.0% Hawaiian with 7 Hawaiian residents.
0.7% Other with 484 Other residents.
3.3% Two Or More with 2,248 Two Or More residents.
10.4% Hispanic with 7,069 Hispanic residents.
| Race | Gary | IN | USA |
|---|---|---|---|
| White | 9.4% | 75.4% | 57.4% |
| African American | 75.7% | 9.1% | 11.9% |
| American Indian | 0.1% | 0.1% | 0.5% |
| Asian | 0.4% | 2.6% | 5.9% |
| Hawaiian | 0.0% | 0.0% | 0.2% |
| Other | 0.7% | 0.4% | 0.6% |
| Two Or More | 3.3% | 3.8% | 4.3% |
| Hispanic | 10.4% | 8.6% | 19.3% |
Gender in Gary
See the full breakdown
Gary is 53.3% female with 36,326 female residents.
Gary is 46.7% male with 31,787 male residents.
| Gender | Gary | IN | USA |
|---|---|---|---|
| Female | 53.3% | 50.4% | 50.5% |
| Male | 46.7% | 49.6% | 49.5% |
Highest level of educational attainment in Gary for adults over 25
See the full breakdown
5.0% of adults in Gary completed < 9th grade.
9.0% of adults in Gary completed 9-12th grade.
37.0% of adults in Gary completed high school / ged.
24.0% of adults in Gary completed some college.
10.0% of adults in Gary completed associate's degree.
10.0% of adults in Gary completed bachelor's degree.
4.0% of adults in Gary completed master's degree.
1.0% of adults in Gary completed professional degree.
0.0% of adults in Gary completed doctorate degree.
| Education | Gary | IN | USA |
|---|---|---|---|
| < 9th Grade | 5.0% | 3.0% | 4.0% |
| 9-12th Grade | 9.0% | 6.0% | 6.0% |
| High School / GED | 37.0% | 33.0% | 26.0% |
| Some College | 24.0% | 19.0% | 19.0% |
| Associate's Degree | 10.0% | 9.0% | 9.0% |
| Bachelor's Degree | 10.0% | 19.0% | 22.0% |
| Master's Degree | 4.0% | 8.0% | 10.0% |
| Professional Degree | 1.0% | 2.0% | 2.0% |
| Doctorate Degree | 0.0% | 1.0% | 2.0% |
Household Income For Gary, Indiana
See the full breakdown
14.6% of households in Gary earn Less than $10,000.
6.9% of households in Gary earn $10,000 to $14,999.
12.1% of households in Gary earn $15,000 to $24,999.
12.2% of households in Gary earn $25,000 to $34,999.
14.3% of households in Gary earn $35,000 to $49,999.
16.5% of households in Gary earn $50,000 to $74,999.
8.6% of households in Gary earn $75,000 to $99,999.
8.4% of households in Gary earn $100,000 to $149,999.
3.6% of households in Gary earn $150,000 to $199,999.
2.8% of households in Gary earn $200,000 or more.
| Income | Gary | IN | USA |
|---|---|---|---|
| Less than $10,000 | 14.6% | 4.9% | 5.0% |
| $10,000 to $14,999 | 6.9% | 3.4% | 3.4% |
| $15,000 to $24,999 | 12.1% | 6.8% | 6.3% |
| $25,000 to $34,999 | 12.2% | 7.5% | 6.6% |
| $35,000 to $49,999 | 14.3% | 11.8% | 10.1% |
| $50,000 to $74,999 | 16.5% | 17.7% | 15.5% |
| $75,000 to $99,999 | 8.6% | 13.9% | 12.6% |
| $100,000 to $149,999 | 8.4% | 17.5% | 17.5% |
| $150,000 to $199,999 | 3.6% | 8.3% | 9.6% |
| $200,000 or more | 2.8% | 8.2% | 13.4% |
Source: U.S. Census ACS 5-year estimates (2024)


