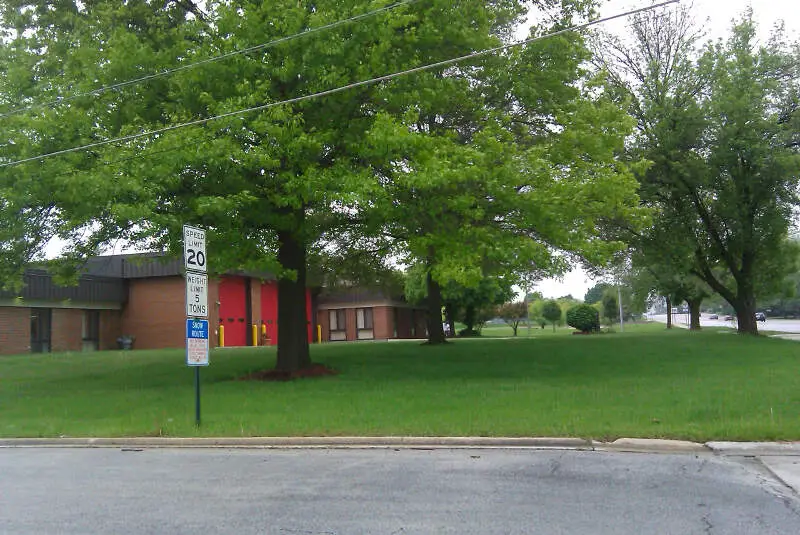
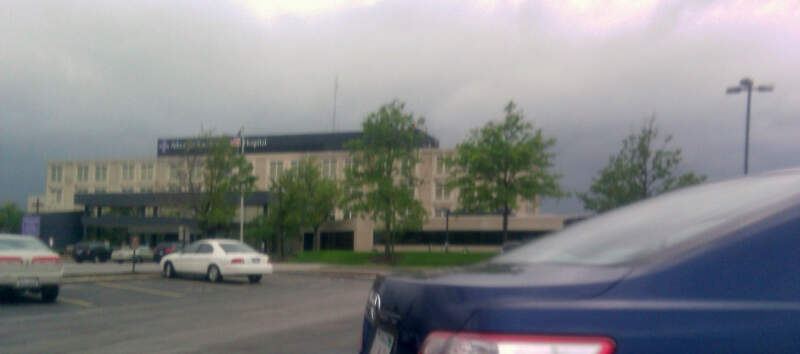
Hazel Crest, IL
Demographics And Statistics
Living In Hazel Crest, Illinois Summary
Life in Hazel Crest research summary. HomeSnacks has been using Saturday Night Science to research the quality of life in Hazel Crest over the past nine years using Census, FBI, Zillow, and other primary data sources. Based on the most recently available data, we found the following about life in Hazel Crest:
The population in Hazel Crest is 13,493.
The median home value in Hazel Crest is $178,107.
The median income in Hazel Crest is $62,773.
The cost of living in Hazel Crest is 96 which is 1.0x lower than the national average.
The median rent in Hazel Crest is $1,439.
The unemployment rate in Hazel Crest is 14.7%.
The poverty rate in Hazel Crest is 21.4%.
The average high in Hazel Crest is 59.5° and the average low is 41.4°.
Hazel Crest SnackAbility
Overall SnackAbility
Hazel Crest, IL Crime Report
Crime in Hazel Crest summary. We use data from the FBI to determine the crime rates in Hazel Crest. Key points include:
There were 407 total crimes in Hazel Crest in the last reporting year.
The overall crime rate per 100,000 people in Hazel Crest is 3,233.2 / 100k people.
The violent crime rate per 100,000 people in Hazel Crest is 540.2 / 100k people.
The property crime rate per 100,000 people in Hazel Crest is 2,693.0 / 100k people.
Overall, crime in Hazel Crest is 52.57% above the national average.
Total Crimes
Above National Average
Crime In Hazel Crest Comparison Table
| Statistic | Count Raw |
Hazel Crest / 100k People |
Illinois / 100k People |
National / 100k People |
|---|---|---|---|---|
| Total Crimes Per 100K | 407 | 3,233.2 | 2,004.4 | 2,119.2 |
| Violent Crime | 68 | 540.2 | 289.2 | 359.0 |
| Murder | 0 | 0.0 | 5.8 | 5.0 |
| Robbery | 19 | 150.9 | 90.2 | 61.0 |
| Aggravated Assault | 40 | 317.8 | 146.3 | 256.0 |
| Property Crime | 339 | 2,693.0 | 1,715.2 | 1,760.0 |
| Burglary | 79 | 627.6 | 290.5 | 229.0 |
| Larceny | 174 | 1,382.3 | 1,134.4 | 1,272.0 |
| Car Theft | 86 | 683.2 | 290.4 | 259.0 |
Hazel Crest, IL Cost Of Living
Cost of living in Hazel Crest summary. We use data on the cost of living to determine how expensive it is to live in Hazel Crest. Real estate prices drive most of the variance in cost of living around Illinois. Key points include:
The cost of living in Hazel Crest is 96 with 100 being average.
The cost of living in Hazel Crest is 1.0x lower than the national average.
The median home value in Hazel Crest is $178,107.
The median income in Hazel Crest is $62,773.
Hazel Crest's Overall Cost Of Living
Lower Than The National Average
Cost Of Living In Hazel Crest Comparison Table
| Living Expense | Hazel Crest | Illinois | National Average | |
|---|---|---|---|---|
| Overall | 96 | 97 | 100 | |
| Services | 105 | 95 | 100 | |
| Groceries | 97 | 99 | 100 | |
| Health | 98 | 93 | 100 | |
| Housing | 93 | 95 | 100 | |
| Transportation | 115 | 102 | 100 | |
| Utilities | 81 | 91 | 100 | |
Hazel Crest, IL Weather
The average high in Hazel Crest is 59.5° and the average low is 41.4°.
There are 72.8 days of precipitation each year.
Expect an average of 39.0 inches of precipitation each year with 30.0 inches of snow.
| Stat | Hazel Crest |
|---|---|
| Average Annual High | 59.5 |
| Average Annual Low | 41.4 |
| Annual Precipitation Days | 72.8 |
| Average Annual Precipitation | 39.0 |
| Average Annual Snowfall | 30.0 |
Average High
Days of Rain
Hazel Crest, IL Photos
Rankings for Hazel Crest in Illinois


Locations Around Hazel Crest
Map Of Hazel Crest, IL
Best Places Around Hazel Crest
Hinsdale, IL
Population 17,155
Burr Ridge, IL
Population 11,119
Darien, IL
Population 21,855
La Grange, IL
Population 15,999
Western Springs, IL
Population 13,353
Tinley Park, IL
Population 55,007
Flossmoor, IL
Population 9,666
Palos Heights, IL
Population 11,817
Orland Park, IL
Population 57,961
Lemont, IL
Population 17,643
Hazel Crest Demographics And Statistics
Population over time in Hazel Crest
The current population in Hazel Crest is 13,493. The population has decreased -5.5% from 2010.
| Year | Population | % Change |
|---|---|---|
| 2023 | 13,493 | -1.8% |
| 2022 | 13,737 | 0.1% |
| 2021 | 13,727 | -1.4% |
| 2020 | 13,918 | 2.7% |
| 2019 | 13,549 | -1.3% |
| 2018 | 13,729 | -1.5% |
| 2017 | 13,935 | 0.1% |
| 2016 | 13,924 | -1.9% |
| 2015 | 14,195 | 0.7% |
| 2014 | 14,102 | -1.7% |
| 2013 | 14,350 | 0.1% |
| 2012 | 14,341 | -0.1% |
| 2011 | 14,353 | 0.6% |
| 2010 | 14,271 | - |
Race / Ethnicity in Hazel Crest
Hazel Crest is:
6.5% White with 877 White residents.
85.4% African American with 11,517 African American residents.
0.0% American Indian with 0 American Indian residents.
0.1% Asian with 19 Asian residents.
0.0% Hawaiian with 0 Hawaiian residents.
1.0% Other with 139 Other residents.
1.1% Two Or More with 146 Two Or More residents.
5.9% Hispanic with 795 Hispanic residents.
| Race | Hazel Crest | IL | USA |
|---|---|---|---|
| White | 6.5% | 58.7% | 58.2% |
| African American | 85.4% | 13.6% | 12.0% |
| American Indian | 0.0% | 0.1% | 0.5% |
| Asian | 0.1% | 5.8% | 5.7% |
| Hawaiian | 0.0% | 0.0% | 0.2% |
| Other | 1.0% | 0.3% | 0.5% |
| Two Or More | 1.1% | 3.0% | 3.9% |
| Hispanic | 5.9% | 18.5% | 19.0% |
Gender in Hazel Crest
Hazel Crest is 55.0% female with 7,419 female residents.
Hazel Crest is 45.0% male with 6,073 male residents.
| Gender | Hazel Crest | IL | USA |
|---|---|---|---|
| Female | 55.0% | 50.6% | 50.5% |
| Male | 45.0% | 49.4% | 49.5% |
Highest level of educational attainment in Hazel Crest for adults over 25
2.0% of adults in Hazel Crest completed < 9th grade.
5.0% of adults in Hazel Crest completed 9-12th grade.
28.0% of adults in Hazel Crest completed high school / ged.
28.0% of adults in Hazel Crest completed some college.
12.0% of adults in Hazel Crest completed associate's degree.
11.0% of adults in Hazel Crest completed bachelor's degree.
12.0% of adults in Hazel Crest completed master's degree.
1.0% of adults in Hazel Crest completed professional degree.
1.0% of adults in Hazel Crest completed doctorate degree.
| Education | Hazel Crest | IL | USA |
|---|---|---|---|
| < 9th Grade | 2.0% | 5.0% | 5.0% |
| 9-12th Grade | 5.0% | 5.0% | 6.0% |
| High School / GED | 28.0% | 25.0% | 26.0% |
| Some College | 28.0% | 20.0% | 19.0% |
| Associate's Degree | 12.0% | 8.0% | 9.0% |
| Bachelor's Degree | 11.0% | 22.0% | 21.0% |
| Master's Degree | 12.0% | 11.0% | 10.0% |
| Professional Degree | 1.0% | 2.0% | 2.0% |
| Doctorate Degree | 1.0% | 2.0% | 2.0% |
Household Income For Hazel Crest, Illinois
13.9% of households in Hazel Crest earn Less than $10,000.
0.6% of households in Hazel Crest earn $10,000 to $14,999.
4.1% of households in Hazel Crest earn $15,000 to $24,999.
6.1% of households in Hazel Crest earn $25,000 to $34,999.
13.7% of households in Hazel Crest earn $35,000 to $49,999.
19.5% of households in Hazel Crest earn $50,000 to $74,999.
11.6% of households in Hazel Crest earn $75,000 to $99,999.
18.0% of households in Hazel Crest earn $100,000 to $149,999.
5.5% of households in Hazel Crest earn $150,000 to $199,999.
7.0% of households in Hazel Crest earn $200,000 or more.
| Income | Hazel Crest | IL | USA |
|---|---|---|---|
| Less than $10,000 | 13.9% | 5.2% | 4.9% |
| $10,000 to $14,999 | 0.6% | 3.4% | 3.6% |
| $15,000 to $24,999 | 4.1% | 6.2% | 6.6% |
| $25,000 to $34,999 | 6.1% | 6.5% | 6.8% |
| $35,000 to $49,999 | 13.7% | 9.9% | 10.4% |
| $50,000 to $74,999 | 19.5% | 15.1% | 15.7% |
| $75,000 to $99,999 | 11.6% | 12.7% | 12.7% |
| $100,000 to $149,999 | 18.0% | 17.9% | 17.4% |
| $150,000 to $199,999 | 5.5% | 9.9% | 9.3% |
| $200,000 or more | 7.0% | 13.1% | 12.6% |


