Goshen SnackAbility
Overall SnackAbility
Crime in Goshen summary. We use data from the FBI to determine the crime rates in Goshen. Key points include:
There were 925 total crimes in Goshen in the last reporting year.
The overall crime rate per 100,000 people in Goshen is 2,696.2 / 100k people.
The violent crime rate per 100,000 people in Goshen is 221.5 / 100k people.
The property crime rate per 100,000 people in Goshen is 2,474.6 / 100k people.
Overall, crime in Goshen is 27.22% above the national average.
Total Crimes
Above National Average
Crime In Goshen Comparison Table
| Statistic | Count Raw |
Goshen / 100k People |
Indiana / 100k People |
National / 100k People |
|---|---|---|---|---|
| Total Crimes Per 100K | 925 | 2,696.2 | 1,691.5 | 2,119.2 |
| Violent Crime | 76 | 221.5 | 312.9 | 359.0 |
| Murder | 0 | 0.0 | 5.5 | 5.0 |
| Robbery | 10 | 29.1 | 34.5 | 61.0 |
| Aggravated Assault | 42 | 122.4 | 239.4 | 256.0 |
| Property Crime | 849 | 2,474.6 | 1,378.6 | 1,760.0 |
| Burglary | 93 | 271.1 | 176.8 | 229.0 |
| Larceny | 711 | 2,072.4 | 988.8 | 1,272.0 |
| Car Theft | 45 | 131.2 | 213.0 | 259.0 |
Source: FBI Uniform Crime Reporting (2024)
Cost of living in Goshen summary. We use data on the cost of living to determine how expensive it is to live in Goshen. Real estate prices drive most of the variance in cost of living around Indiana. Key points include:
The cost of living in Goshen is 88 with 100 being average.
The cost of living in Goshen is 0.9x lower than the national average.
The median home value in Goshen is $275,119.
The median income in Goshen is $59,184.
Goshen's Overall Cost Of Living
Lower Than The National Average
Cost Of Living In Goshen Comparison Table
| Living Expense | Goshen | Indiana | National Average |
|---|---|---|---|
| Overall | 88 | 90 | 100 |
| Services | 98 | 97 | 100 |
| Groceries | 96 | 95 | 100 |
| Health | 77 | 72 | 100 |
| Housing | 93 | 98 | 100 |
| Transportation | 98 | 94 | 100 |
| Utilities | 93 | 96 | 100 |
Source: Cost of living index, normalized to US average = 100
Goshen, IN Weather
The average high in Goshen is 59.2° and the average low is 40.0°.
There are 78.1 days of precipitation each year.
Expect an average of 38.8 inches of precipitation each year with 41.7 inches of snow.
| Stat | Goshen |
|---|---|
| Average Annual High | 59.2 |
| Average Annual Low | 40.0 |
| Annual Precipitation Days | 78.1 |
| Average Annual Precipitation | 38.8 |
| Average Annual Snowfall | 41.7 |
Average High
Days of Rain
Source: NOAA climate normals (30-year)
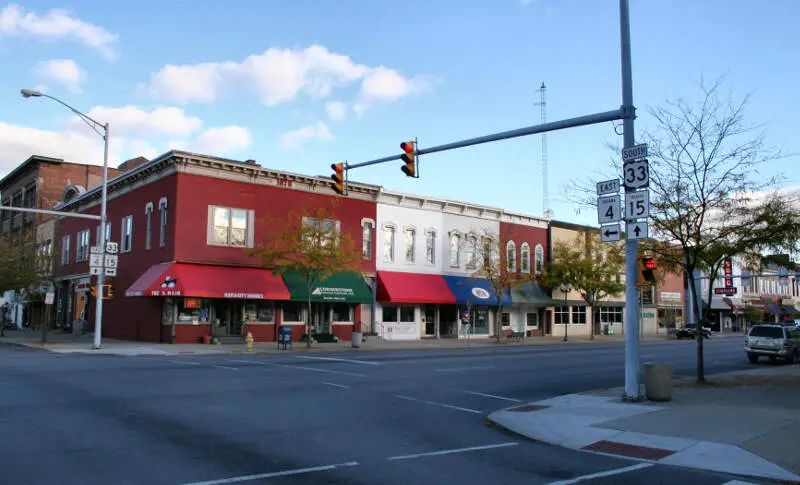
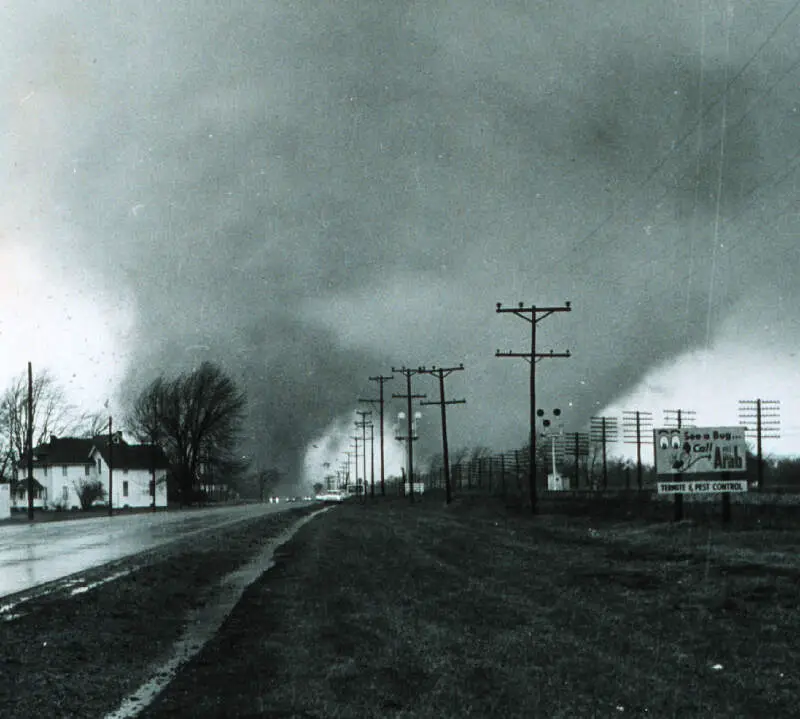
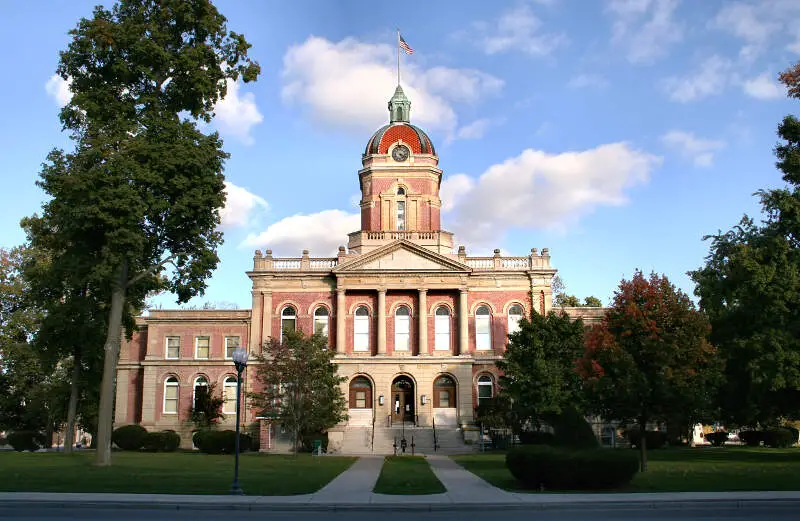
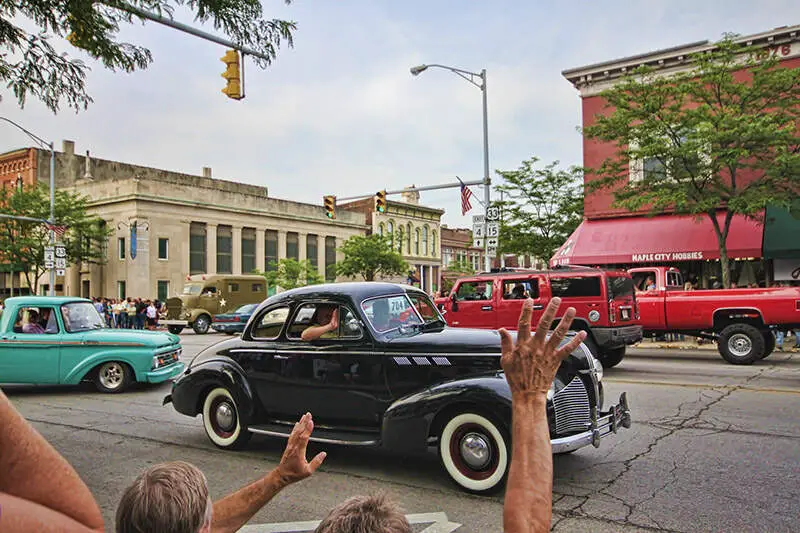
Goshen, IN Photos

1 Reviews & Comments About Goshen

I was born and raised in Goshen. Schizophrenic city. Prides itself on its Mennonites and Amish, but if you get caught at night on the north side you'll likely get mugged. However, the city, just like the state as a whole, is about as right-wing Republican as the rest of the state.
My wife is from Brazil. Even worse, much smaller town where if you weren't born there you will never belong, period and it's close enough to Terre Haute that you can smell 'that smell' that the Haute is known for.
Rankings & Articles For Goshen


Locations Around Goshen
Map Of Goshen, IN
Best Places Around Goshen
Dunlap, IN
Population 6,109
Nappanee, IN
Population 6,815
Granger, IN
Population 30,321
Mishawaka, IN
Population 51,021
Elkhart, IN
Population 53,733
Goshen Demographics And Statistics
Population over time in Goshen
The current population in Goshen is 34,420. The population has increased 10.1% from 2010.
| Year | Population | % Change |
|---|---|---|
| 2024 | 34,420 | 0.1% |
| 2023 | 34,374 | -1.0% |
| 2022 | 34,704 | -0.3% |
| 2021 | 34,792 | 0.6% |
| 2020 | 34,586 | 1.4% |
| 2019 | 34,108 | 0.6% |
| 2018 | 33,915 | 1.0% |
| 2017 | 33,583 | 0.6% |
| 2016 | 33,385 | 1.3% |
| 2015 | 32,946 | 2.0% |
| 2014 | 32,297 | 1.8% |
| 2013 | 31,722 | 0.5% |
| 2012 | 31,569 | 0.6% |
| 2011 | 31,386 | 0.4% |
| 2010 | 31,261 | - |
Race / Ethnicity in Goshen
See the full breakdown
Goshen is:
58.7% White with 20,212 White residents.
2.3% African American with 798 African American residents.
0.4% American Indian with 134 American Indian residents.
1.1% Asian with 386 Asian residents.
0.1% Hawaiian with 30 Hawaiian residents.
1.0% Other with 338 Other residents.
2.6% Two Or More with 880 Two Or More residents.
33.8% Hispanic with 11,642 Hispanic residents.
| Race | Goshen | IN | USA |
|---|---|---|---|
| White | 58.7% | 75.4% | 57.4% |
| African American | 2.3% | 9.1% | 11.9% |
| American Indian | 0.4% | 0.1% | 0.5% |
| Asian | 1.1% | 2.6% | 5.9% |
| Hawaiian | 0.1% | 0.0% | 0.2% |
| Other | 1.0% | 0.4% | 0.6% |
| Two Or More | 2.6% | 3.8% | 4.3% |
| Hispanic | 33.8% | 8.6% | 19.3% |
Gender in Goshen
See the full breakdown
Goshen is 52.7% female with 18,126 female residents.
Goshen is 47.3% male with 16,294 male residents.
| Gender | Goshen | IN | USA |
|---|---|---|---|
| Female | 52.7% | 50.4% | 50.5% |
| Male | 47.3% | 49.6% | 49.5% |
Highest level of educational attainment in Goshen for adults over 25
See the full breakdown
8.0% of adults in Goshen completed < 9th grade.
9.0% of adults in Goshen completed 9-12th grade.
37.0% of adults in Goshen completed high school / ged.
17.0% of adults in Goshen completed some college.
5.0% of adults in Goshen completed associate's degree.
14.0% of adults in Goshen completed bachelor's degree.
8.0% of adults in Goshen completed master's degree.
1.0% of adults in Goshen completed professional degree.
1.0% of adults in Goshen completed doctorate degree.
| Education | Goshen | IN | USA |
|---|---|---|---|
| < 9th Grade | 8.0% | 3.0% | 4.0% |
| 9-12th Grade | 9.0% | 6.0% | 6.0% |
| High School / GED | 37.0% | 33.0% | 26.0% |
| Some College | 17.0% | 19.0% | 19.0% |
| Associate's Degree | 5.0% | 9.0% | 9.0% |
| Bachelor's Degree | 14.0% | 19.0% | 22.0% |
| Master's Degree | 8.0% | 8.0% | 10.0% |
| Professional Degree | 1.0% | 2.0% | 2.0% |
| Doctorate Degree | 1.0% | 1.0% | 2.0% |
Household Income For Goshen, Indiana
See the full breakdown
4.2% of households in Goshen earn Less than $10,000.
3.3% of households in Goshen earn $10,000 to $14,999.
7.5% of households in Goshen earn $15,000 to $24,999.
9.4% of households in Goshen earn $25,000 to $34,999.
16.3% of households in Goshen earn $35,000 to $49,999.
22.4% of households in Goshen earn $50,000 to $74,999.
14.5% of households in Goshen earn $75,000 to $99,999.
15.1% of households in Goshen earn $100,000 to $149,999.
3.9% of households in Goshen earn $150,000 to $199,999.
3.4% of households in Goshen earn $200,000 or more.
| Income | Goshen | IN | USA |
|---|---|---|---|
| Less than $10,000 | 4.2% | 4.9% | 5.0% |
| $10,000 to $14,999 | 3.3% | 3.4% | 3.4% |
| $15,000 to $24,999 | 7.5% | 6.8% | 6.3% |
| $25,000 to $34,999 | 9.4% | 7.5% | 6.6% |
| $35,000 to $49,999 | 16.3% | 11.8% | 10.1% |
| $50,000 to $74,999 | 22.4% | 17.7% | 15.5% |
| $75,000 to $99,999 | 14.5% | 13.9% | 12.6% |
| $100,000 to $149,999 | 15.1% | 17.5% | 17.5% |
| $150,000 to $199,999 | 3.9% | 8.3% | 9.6% |
| $200,000 or more | 3.4% | 8.2% | 13.4% |
Source: U.S. Census ACS 5-year estimates (2024)


