Mishawaka SnackAbility
Overall SnackAbility
Crime in Mishawaka summary. We use data from the FBI to determine the crime rates in Mishawaka. Key points include:
There were 1,425 total crimes in Mishawaka in the last reporting year.
The overall crime rate per 100,000 people in Mishawaka is 2,806.4 / 100k people.
The violent crime rate per 100,000 people in Mishawaka is 236.3 / 100k people.
The property crime rate per 100,000 people in Mishawaka is 2,570.1 / 100k people.
Overall, crime in Mishawaka is 32.43% above the national average.
Total Crimes
Above National Average
Crime In Mishawaka Comparison Table
| Statistic | Count Raw |
Mishawaka / 100k People |
Indiana / 100k People |
National / 100k People |
|---|---|---|---|---|
| Total Crimes Per 100K | 1,425 | 2,806.4 | 1,691.5 | 2,119.2 |
| Violent Crime | 120 | 236.3 | 312.9 | 359.0 |
| Murder | 0 | 0.0 | 5.5 | 5.0 |
| Robbery | 17 | 33.5 | 34.5 | 61.0 |
| Aggravated Assault | 80 | 157.6 | 239.4 | 256.0 |
| Property Crime | 1,305 | 2,570.1 | 1,378.6 | 1,760.0 |
| Burglary | 176 | 346.6 | 176.8 | 229.0 |
| Larceny | 1,015 | 1,999.0 | 988.8 | 1,272.0 |
| Car Theft | 114 | 224.5 | 213.0 | 259.0 |
Source: FBI Uniform Crime Reporting (2024)
Cost of living in Mishawaka summary. We use data on the cost of living to determine how expensive it is to live in Mishawaka. Real estate prices drive most of the variance in cost of living around Indiana. Key points include:
The cost of living in Mishawaka is 85 with 100 being average.
The cost of living in Mishawaka is 0.8x lower than the national average.
The median home value in Mishawaka is $206,366.
The median income in Mishawaka is $54,291.
Mishawaka's Overall Cost Of Living
Lower Than The National Average
Cost Of Living In Mishawaka Comparison Table
| Living Expense | Mishawaka | Indiana | National Average |
|---|---|---|---|
| Overall | 85 | 90 | 100 |
| Services | 97 | 97 | 100 |
| Groceries | 99 | 95 | 100 |
| Health | 68 | 72 | 100 |
| Housing | 96 | 98 | 100 |
| Transportation | 98 | 94 | 100 |
| Utilities | 101 | 96 | 100 |
Source: Cost of living index, normalized to US average = 100
Mishawaka, IN Weather
The average high in Mishawaka is 59.1° and the average low is 40.1°.
There are 78.9 days of precipitation each year.
Expect an average of 39.5 inches of precipitation each year with 61.6 inches of snow.
| Stat | Mishawaka |
|---|---|
| Average Annual High | 59.1 |
| Average Annual Low | 40.1 |
| Annual Precipitation Days | 78.9 |
| Average Annual Precipitation | 39.5 |
| Average Annual Snowfall | 61.6 |
Average High
Days of Rain
Source: NOAA climate normals (30-year)
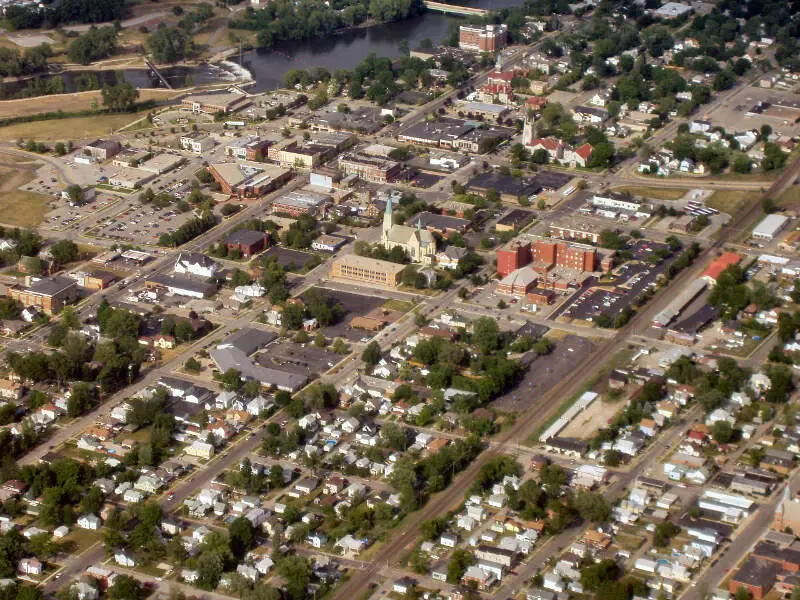
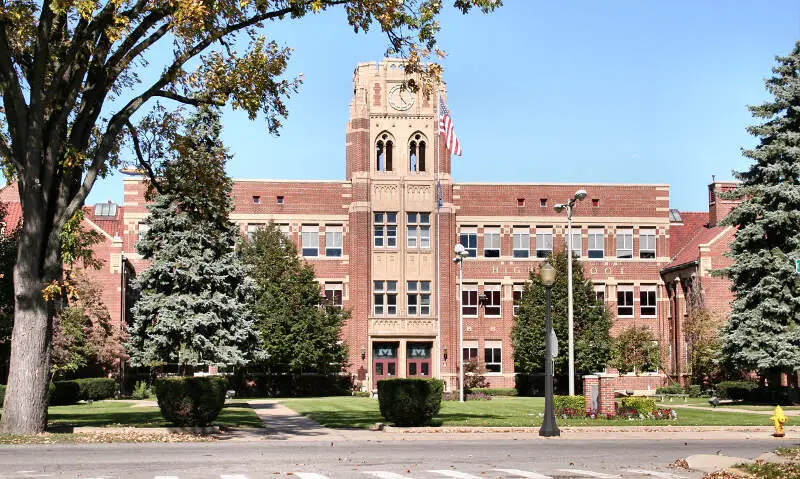
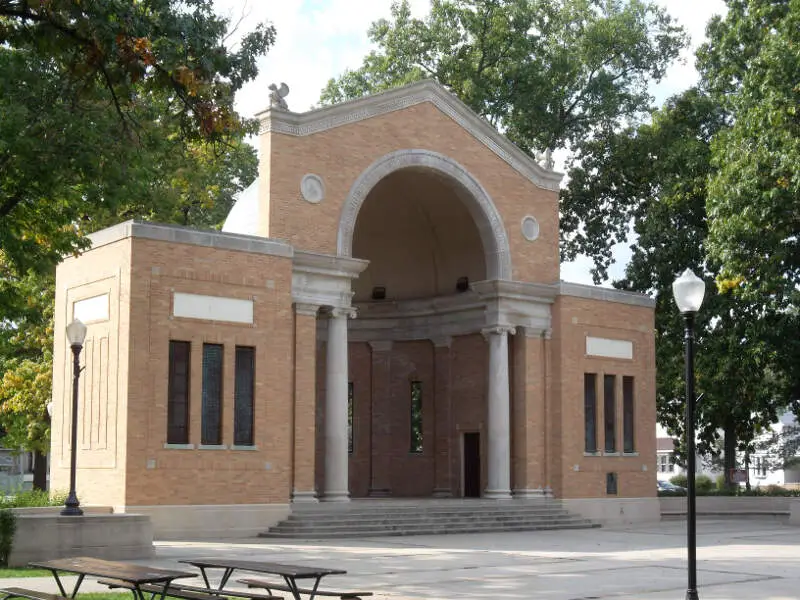
Mishawaka, IN Photos
1 Reviews & Comments About Mishawaka

I grew up roughly half an hour away from Mishawaka and also lived there for two years as an adult so I have some experience with the area. The shopping is fantastic and that's about the only good thing I can say. There are many decent hotel and restaurant options for people who are traveling.
The apartments are extremely overpriced for what they are and have largely negative reviews. Crime rates have gone up in recent years. Many rich people like to shop in this area and they tend to be confrontational and rude.
Rankings & Articles For Mishawaka


Locations Around Mishawaka
Map Of Mishawaka, IN
Best Places Around Mishawaka
Dunlap, IN
Population 6,109
Nappanee, IN
Population 6,815
Granger, IN
Population 30,321
Goshen, IN
Population 34,420
Niles, MI
Population 11,803
Elkhart, IN
Population 53,733
Mishawaka Demographics And Statistics
Population over time in Mishawaka
The current population in Mishawaka is 51,021. The population has increased 6.5% from 2010.
| Year | Population | % Change |
|---|---|---|
| 2024 | 51,021 | 0.2% |
| 2023 | 50,907 | 0.0% |
| 2022 | 50,899 | 0.1% |
| 2021 | 50,823 | 2.3% |
| 2020 | 49,675 | 0.9% |
| 2019 | 49,245 | 0.7% |
| 2018 | 48,926 | 0.7% |
| 2017 | 48,582 | 0.7% |
| 2016 | 48,234 | 0.2% |
| 2015 | 48,121 | 0.0% |
| 2014 | 48,120 | 0.1% |
| 2013 | 48,079 | -0.1% |
| 2012 | 48,107 | 0.1% |
| 2011 | 48,060 | 0.4% |
| 2010 | 47,891 | - |
Race / Ethnicity in Mishawaka
See the full breakdown
Mishawaka is:
73.7% White with 37,594 White residents.
10.7% African American with 5,471 African American residents.
0.1% American Indian with 27 American Indian residents.
2.4% Asian with 1,240 Asian residents.
0.0% Hawaiian with 0 Hawaiian residents.
0.4% Other with 213 Other residents.
6.3% Two Or More with 3,211 Two Or More residents.
6.4% Hispanic with 3,265 Hispanic residents.
| Race | Mishawaka | IN | USA |
|---|---|---|---|
| White | 73.7% | 75.4% | 57.4% |
| African American | 10.7% | 9.1% | 11.9% |
| American Indian | 0.1% | 0.1% | 0.5% |
| Asian | 2.4% | 2.6% | 5.9% |
| Hawaiian | 0.0% | 0.0% | 0.2% |
| Other | 0.4% | 0.4% | 0.6% |
| Two Or More | 6.3% | 3.8% | 4.3% |
| Hispanic | 6.4% | 8.6% | 19.3% |
Gender in Mishawaka
See the full breakdown
Mishawaka is 50.4% female with 25,710 female residents.
Mishawaka is 49.6% male with 25,311 male residents.
| Gender | Mishawaka | IN | USA |
|---|---|---|---|
| Female | 50.4% | 50.4% | 50.5% |
| Male | 49.6% | 49.6% | 49.5% |
Highest level of educational attainment in Mishawaka for adults over 25
See the full breakdown
1.0% of adults in Mishawaka completed < 9th grade.
7.0% of adults in Mishawaka completed 9-12th grade.
32.0% of adults in Mishawaka completed high school / ged.
23.0% of adults in Mishawaka completed some college.
8.0% of adults in Mishawaka completed associate's degree.
18.0% of adults in Mishawaka completed bachelor's degree.
7.0% of adults in Mishawaka completed master's degree.
2.0% of adults in Mishawaka completed professional degree.
2.0% of adults in Mishawaka completed doctorate degree.
| Education | Mishawaka | IN | USA |
|---|---|---|---|
| < 9th Grade | 1.0% | 3.0% | 4.0% |
| 9-12th Grade | 7.0% | 6.0% | 6.0% |
| High School / GED | 32.0% | 33.0% | 26.0% |
| Some College | 23.0% | 19.0% | 19.0% |
| Associate's Degree | 8.0% | 9.0% | 9.0% |
| Bachelor's Degree | 18.0% | 19.0% | 22.0% |
| Master's Degree | 7.0% | 8.0% | 10.0% |
| Professional Degree | 2.0% | 2.0% | 2.0% |
| Doctorate Degree | 2.0% | 1.0% | 2.0% |
Household Income For Mishawaka, Indiana
See the full breakdown
5.1% of households in Mishawaka earn Less than $10,000.
4.0% of households in Mishawaka earn $10,000 to $14,999.
9.5% of households in Mishawaka earn $15,000 to $24,999.
10.5% of households in Mishawaka earn $25,000 to $34,999.
17.4% of households in Mishawaka earn $35,000 to $49,999.
19.4% of households in Mishawaka earn $50,000 to $74,999.
12.4% of households in Mishawaka earn $75,000 to $99,999.
12.2% of households in Mishawaka earn $100,000 to $149,999.
4.5% of households in Mishawaka earn $150,000 to $199,999.
4.8% of households in Mishawaka earn $200,000 or more.
| Income | Mishawaka | IN | USA |
|---|---|---|---|
| Less than $10,000 | 5.1% | 4.9% | 5.0% |
| $10,000 to $14,999 | 4.0% | 3.4% | 3.4% |
| $15,000 to $24,999 | 9.5% | 6.8% | 6.3% |
| $25,000 to $34,999 | 10.5% | 7.5% | 6.6% |
| $35,000 to $49,999 | 17.4% | 11.8% | 10.1% |
| $50,000 to $74,999 | 19.4% | 17.7% | 15.5% |
| $75,000 to $99,999 | 12.4% | 13.9% | 12.6% |
| $100,000 to $149,999 | 12.2% | 17.5% | 17.5% |
| $150,000 to $199,999 | 4.5% | 8.3% | 9.6% |
| $200,000 or more | 4.8% | 8.2% | 13.4% |
Source: U.S. Census ACS 5-year estimates (2024)


