Merrillville SnackAbility
Overall SnackAbility
Crime in Merrillville summary. We use data from the FBI to determine the crime rates in Merrillville. Key points include:
There were 520 total crimes in Merrillville in the last reporting year.
The overall crime rate per 100,000 people in Merrillville is 1,495.4 / 100k people.
The violent crime rate per 100,000 people in Merrillville is 138.0 / 100k people.
The property crime rate per 100,000 people in Merrillville is 1,357.3 / 100k people.
Overall, crime in Merrillville is -29.44% below the national average.
Total Crimes
Below National Average
Crime In Merrillville Comparison Table
| Statistic | Count Raw |
Merrillville / 100k People |
Indiana / 100k People |
National / 100k People |
|---|---|---|---|---|
| Total Crimes Per 100K | 520 | 1,495.4 | 1,691.5 | 2,119.2 |
| Violent Crime | 48 | 138.0 | 312.9 | 359.0 |
| Murder | 7 | 20.1 | 5.5 | 5.0 |
| Robbery | 16 | 46.0 | 34.5 | 61.0 |
| Aggravated Assault | 22 | 63.3 | 239.4 | 256.0 |
| Property Crime | 472 | 1,357.3 | 1,378.6 | 1,760.0 |
| Burglary | 76 | 218.6 | 176.8 | 229.0 |
| Larceny | 310 | 891.5 | 988.8 | 1,272.0 |
| Car Theft | 86 | 247.3 | 213.0 | 259.0 |
Source: FBI Uniform Crime Reporting (2024)
Cost of living in Merrillville summary. We use data on the cost of living to determine how expensive it is to live in Merrillville. Real estate prices drive most of the variance in cost of living around Indiana. Key points include:
The cost of living in Merrillville is 92 with 100 being average.
The cost of living in Merrillville is 0.9x lower than the national average.
The median home value in Merrillville is $240,328.
The median income in Merrillville is $67,587.
Merrillville's Overall Cost Of Living
Lower Than The National Average
Cost Of Living In Merrillville Comparison Table
| Living Expense | Merrillville | Indiana | National Average |
|---|---|---|---|
| Overall | 92 | 90 | 100 |
| Services | 97 | 97 | 100 |
| Groceries | 101 | 95 | 100 |
| Health | 90 | 72 | 100 |
| Housing | 96 | 98 | 100 |
| Transportation | 94 | 94 | 100 |
| Utilities | 90 | 96 | 100 |
Source: Cost of living index, normalized to US average = 100
Merrillville, IN Weather
The average high in Merrillville is 59.7° and the average low is 41.7°.
There are 74.3 days of precipitation each year.
Expect an average of 38.3 inches of precipitation each year with 31.9 inches of snow.
| Stat | Merrillville |
|---|---|
| Average Annual High | 59.7 |
| Average Annual Low | 41.7 |
| Annual Precipitation Days | 74.3 |
| Average Annual Precipitation | 38.3 |
| Average Annual Snowfall | 31.9 |
Average High
Days of Rain
Source: NOAA climate normals (30-year)
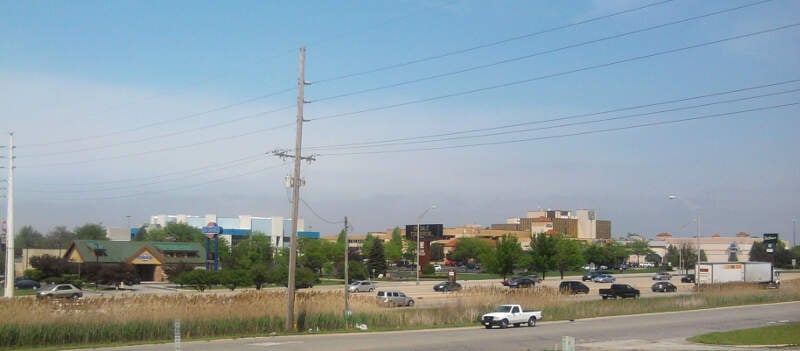
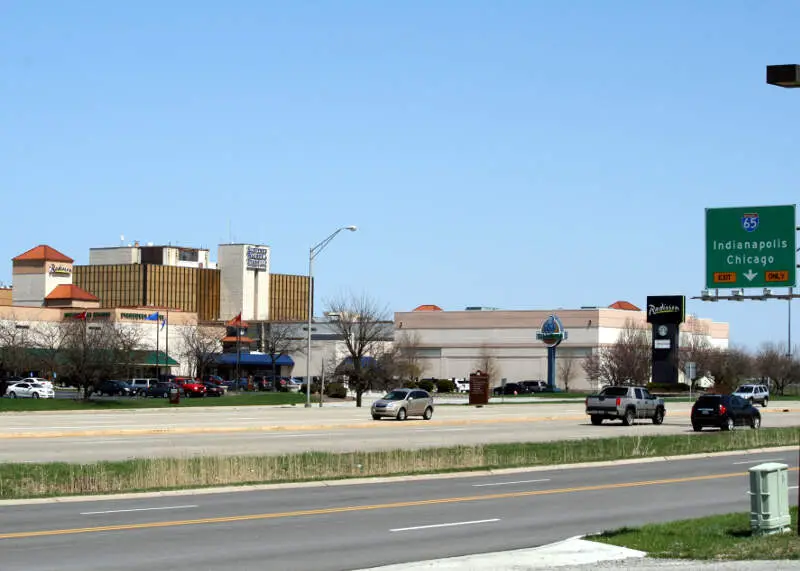
Merrillville, IN Photos


Rankings & Articles For Merrillville


Locations Around Merrillville
Map Of Merrillville, IN
Best Places Around Merrillville
Flossmoor, IL
Population 9,391
Homewood, IL
Population 19,294
South Holland, IL
Population 20,911
Glenwood, IL
Population 8,603
Lansing, IL
Population 28,284
Lynwood, IL
Population 9,083
Dolton, IL
Population 20,825
Crete, IL
Population 8,386
Park Forest, IL
Population 21,156
Steger, IL
Population 9,418
Merrillville Demographics And Statistics
Population over time in Merrillville
The current population in Merrillville is 36,476. The population has increased 5.9% from 2010.
| Year | Population | % Change |
|---|---|---|
| 2024 | 36,476 | 0.4% |
| 2023 | 36,343 | 0.4% |
| 2022 | 36,214 | 0.0% |
| 2021 | 36,196 | 3.8% |
| 2020 | 34,871 | -0.1% |
| 2019 | 34,889 | -0.4% |
| 2018 | 35,032 | -0.4% |
| 2017 | 35,183 | -0.2% |
| 2016 | 35,268 | -0.2% |
| 2015 | 35,322 | 0.2% |
| 2014 | 35,262 | -0.4% |
| 2013 | 35,404 | 0.6% |
| 2012 | 35,201 | 1.2% |
| 2011 | 34,779 | 1.0% |
| 2010 | 34,428 | - |
Race / Ethnicity in Merrillville
See the full breakdown
Merrillville is:
33.4% White with 12,185 White residents.
46.1% African American with 16,811 African American residents.
0.0% American Indian with 0 American Indian residents.
1.0% Asian with 365 Asian residents.
0.0% Hawaiian with 0 Hawaiian residents.
0.8% Other with 283 Other residents.
3.1% Two Or More with 1,140 Two Or More residents.
15.6% Hispanic with 5,692 Hispanic residents.
| Race | Merrillville | IN | USA |
|---|---|---|---|
| White | 33.4% | 75.4% | 57.4% |
| African American | 46.1% | 9.1% | 11.9% |
| American Indian | 0.0% | 0.1% | 0.5% |
| Asian | 1.0% | 2.6% | 5.9% |
| Hawaiian | 0.0% | 0.0% | 0.2% |
| Other | 0.8% | 0.4% | 0.6% |
| Two Or More | 3.1% | 3.8% | 4.3% |
| Hispanic | 15.6% | 8.6% | 19.3% |
Gender in Merrillville
See the full breakdown
Merrillville is 52.2% female with 19,023 female residents.
Merrillville is 47.8% male with 17,453 male residents.
| Gender | Merrillville | IN | USA |
|---|---|---|---|
| Female | 52.2% | 50.4% | 50.5% |
| Male | 47.8% | 49.6% | 49.5% |
Highest level of educational attainment in Merrillville for adults over 25
See the full breakdown
3.0% of adults in Merrillville completed < 9th grade.
5.0% of adults in Merrillville completed 9-12th grade.
34.0% of adults in Merrillville completed high school / ged.
21.0% of adults in Merrillville completed some college.
11.0% of adults in Merrillville completed associate's degree.
16.0% of adults in Merrillville completed bachelor's degree.
8.0% of adults in Merrillville completed master's degree.
1.0% of adults in Merrillville completed professional degree.
1.0% of adults in Merrillville completed doctorate degree.
| Education | Merrillville | IN | USA |
|---|---|---|---|
| < 9th Grade | 3.0% | 3.0% | 4.0% |
| 9-12th Grade | 5.0% | 6.0% | 6.0% |
| High School / GED | 34.0% | 33.0% | 26.0% |
| Some College | 21.0% | 19.0% | 19.0% |
| Associate's Degree | 11.0% | 9.0% | 9.0% |
| Bachelor's Degree | 16.0% | 19.0% | 22.0% |
| Master's Degree | 8.0% | 8.0% | 10.0% |
| Professional Degree | 1.0% | 2.0% | 2.0% |
| Doctorate Degree | 1.0% | 1.0% | 2.0% |
Household Income For Merrillville, Indiana
See the full breakdown
7.2% of households in Merrillville earn Less than $10,000.
4.2% of households in Merrillville earn $10,000 to $14,999.
8.2% of households in Merrillville earn $15,000 to $24,999.
5.7% of households in Merrillville earn $25,000 to $34,999.
13.3% of households in Merrillville earn $35,000 to $49,999.
18.0% of households in Merrillville earn $50,000 to $74,999.
15.1% of households in Merrillville earn $75,000 to $99,999.
15.6% of households in Merrillville earn $100,000 to $149,999.
5.5% of households in Merrillville earn $150,000 to $199,999.
7.4% of households in Merrillville earn $200,000 or more.
| Income | Merrillville | IN | USA |
|---|---|---|---|
| Less than $10,000 | 7.2% | 4.9% | 5.0% |
| $10,000 to $14,999 | 4.2% | 3.4% | 3.4% |
| $15,000 to $24,999 | 8.2% | 6.8% | 6.3% |
| $25,000 to $34,999 | 5.7% | 7.5% | 6.6% |
| $35,000 to $49,999 | 13.3% | 11.8% | 10.1% |
| $50,000 to $74,999 | 18.0% | 17.7% | 15.5% |
| $75,000 to $99,999 | 15.1% | 13.9% | 12.6% |
| $100,000 to $149,999 | 15.6% | 17.5% | 17.5% |
| $150,000 to $199,999 | 5.5% | 8.3% | 9.6% |
| $200,000 or more | 7.4% | 8.2% | 13.4% |
Source: U.S. Census ACS 5-year estimates (2024)


