Pendleton SnackAbility
Overall SnackAbility
Pendleton, IN Weather
The average high in Pendleton is 61.1° and the average low is 41.4°.
There are 77.9 days of precipitation each year.
Expect an average of 41.3 inches of precipitation each year with 18.6 inches of snow.
| Stat | Pendleton |
|---|---|
| Average Annual High | 61.1 |
| Average Annual Low | 41.4 |
| Annual Precipitation Days | 77.9 |
| Average Annual Precipitation | 41.3 |
| Average Annual Snowfall | 18.6 |
Average High
Days of Rain
Source: NOAA climate normals (30-year)
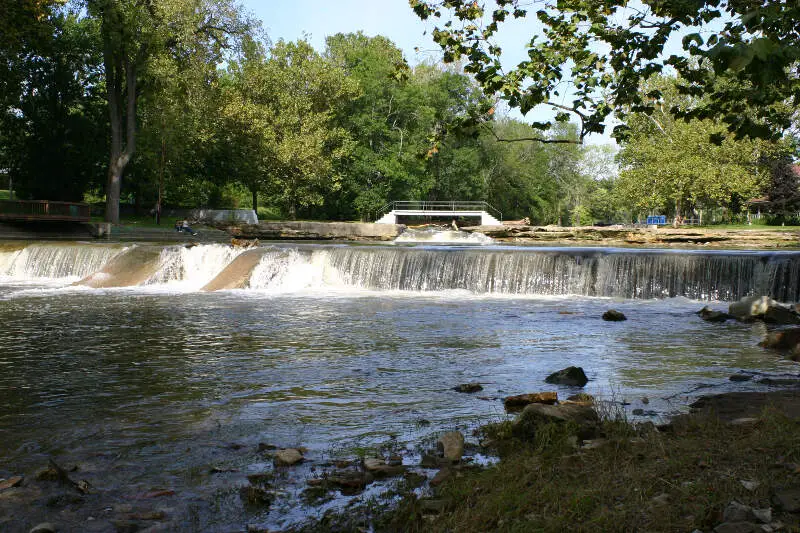
Pendleton, IN Photos
Rankings & Articles For Pendleton


Locations Around Pendleton
Map Of Pendleton, IN
Best Places Around Pendleton
Middletown, KY
Population 9,763
Noblesville, IN
Population 73,362
Lawrence, IN
Population 49,517
Cumberland, IN
Population 6,267
Greenfield, IN
Population 24,940
Elwood, IN
Population 8,356
Anderson, IN
Population 55,367
Pendleton Demographics And Statistics
Population over time in Pendleton
The current population in Pendleton is 5,321. The population has increased 20.4% from 2010.
| Year | Population | % Change |
|---|---|---|
| 2024 | 5,321 | 4.0% |
| 2023 | 5,115 | 3.6% |
| 2022 | 4,937 | 2.2% |
| 2021 | 4,833 | 9.1% |
| 2020 | 4,429 | 4.3% |
| 2019 | 4,246 | 0.8% |
| 2018 | 4,213 | -1.3% |
| 2017 | 4,269 | -0.9% |
| 2016 | 4,307 | 2.0% |
| 2015 | 4,224 | -1.3% |
| 2014 | 4,279 | 1.4% |
| 2013 | 4,218 | -1.7% |
| 2012 | 4,289 | -2.9% |
| 2011 | 4,417 | -0.0% |
| 2010 | 4,419 | - |
Race / Ethnicity in Pendleton
See the full breakdown
Pendleton is:
87.5% White with 4,655 White residents.
0.3% African American with 16 African American residents.
0.0% American Indian with 0 American Indian residents.
0.3% Asian with 18 Asian residents.
0.0% Hawaiian with 0 Hawaiian residents.
0.2% Other with 13 Other residents.
1.9% Two Or More with 100 Two Or More residents.
9.8% Hispanic with 519 Hispanic residents.
| Race | Pendleton | IN | USA |
|---|---|---|---|
| White | 87.5% | 75.4% | 57.4% |
| African American | 0.3% | 9.1% | 11.9% |
| American Indian | 0.0% | 0.1% | 0.5% |
| Asian | 0.3% | 2.6% | 5.9% |
| Hawaiian | 0.0% | 0.0% | 0.2% |
| Other | 0.2% | 0.4% | 0.6% |
| Two Or More | 1.9% | 3.8% | 4.3% |
| Hispanic | 9.8% | 8.6% | 19.3% |
Gender in Pendleton
See the full breakdown
Pendleton is 51.1% female with 2,717 female residents.
Pendleton is 48.9% male with 2,604 male residents.
| Gender | Pendleton | IN | USA |
|---|---|---|---|
| Female | 51.1% | 50.4% | 50.5% |
| Male | 48.9% | 49.6% | 49.5% |
Highest level of educational attainment in Pendleton for adults over 25
See the full breakdown
1.0% of adults in Pendleton completed < 9th grade.
4.0% of adults in Pendleton completed 9-12th grade.
22.0% of adults in Pendleton completed high school / ged.
27.0% of adults in Pendleton completed some college.
12.0% of adults in Pendleton completed associate's degree.
22.0% of adults in Pendleton completed bachelor's degree.
10.0% of adults in Pendleton completed master's degree.
2.0% of adults in Pendleton completed professional degree.
0.0% of adults in Pendleton completed doctorate degree.
| Education | Pendleton | IN | USA |
|---|---|---|---|
| < 9th Grade | 1.0% | 3.0% | 4.0% |
| 9-12th Grade | 4.0% | 6.0% | 6.0% |
| High School / GED | 22.0% | 33.0% | 26.0% |
| Some College | 27.0% | 19.0% | 19.0% |
| Associate's Degree | 12.0% | 9.0% | 9.0% |
| Bachelor's Degree | 22.0% | 19.0% | 22.0% |
| Master's Degree | 10.0% | 8.0% | 10.0% |
| Professional Degree | 2.0% | 2.0% | 2.0% |
| Doctorate Degree | 0.0% | 1.0% | 2.0% |
Household Income For Pendleton, Indiana
See the full breakdown
2.4% of households in Pendleton earn Less than $10,000.
4.6% of households in Pendleton earn $10,000 to $14,999.
5.5% of households in Pendleton earn $15,000 to $24,999.
4.5% of households in Pendleton earn $25,000 to $34,999.
13.1% of households in Pendleton earn $35,000 to $49,999.
14.2% of households in Pendleton earn $50,000 to $74,999.
18.5% of households in Pendleton earn $75,000 to $99,999.
15.5% of households in Pendleton earn $100,000 to $149,999.
11.4% of households in Pendleton earn $150,000 to $199,999.
10.4% of households in Pendleton earn $200,000 or more.
| Income | Pendleton | IN | USA |
|---|---|---|---|
| Less than $10,000 | 2.4% | 4.9% | 5.0% |
| $10,000 to $14,999 | 4.6% | 3.4% | 3.4% |
| $15,000 to $24,999 | 5.5% | 6.8% | 6.3% |
| $25,000 to $34,999 | 4.5% | 7.5% | 6.6% |
| $35,000 to $49,999 | 13.1% | 11.8% | 10.1% |
| $50,000 to $74,999 | 14.2% | 17.7% | 15.5% |
| $75,000 to $99,999 | 18.5% | 13.9% | 12.6% |
| $100,000 to $149,999 | 15.5% | 17.5% | 17.5% |
| $150,000 to $199,999 | 11.4% | 8.3% | 9.6% |
| $200,000 or more | 10.4% | 8.2% | 13.4% |
Source: U.S. Census ACS 5-year estimates (2024)


