Plymouth SnackAbility
Overall SnackAbility
Crime in Plymouth summary. We use data from the FBI to determine the crime rates in Plymouth. Key points include:
There were 168 total crimes in Plymouth in the last reporting year.
The overall crime rate per 100,000 people in Plymouth is 1,685.7 / 100k people.
The violent crime rate per 100,000 people in Plymouth is 50.2 / 100k people.
The property crime rate per 100,000 people in Plymouth is 1,635.6 / 100k people.
Overall, crime in Plymouth is -20.46% below the national average.
Total Crimes
Below National Average
Crime In Plymouth Comparison Table
| Statistic | Count Raw |
Plymouth / 100k People |
Indiana / 100k People |
National / 100k People |
|---|---|---|---|---|
| Total Crimes Per 100K | 168 | 1,685.7 | 1,691.5 | 2,119.2 |
| Violent Crime | 5 | 50.2 | 312.9 | 359.0 |
| Murder | 1 | 10.0 | 5.5 | 5.0 |
| Robbery | 0 | 0.0 | 34.5 | 61.0 |
| Aggravated Assault | 2 | 20.1 | 239.4 | 256.0 |
| Property Crime | 163 | 1,635.6 | 1,378.6 | 1,760.0 |
| Burglary | 13 | 130.4 | 176.8 | 229.0 |
| Larceny | 141 | 1,414.8 | 988.8 | 1,272.0 |
| Car Theft | 9 | 90.3 | 213.0 | 259.0 |
Source: FBI Uniform Crime Reporting (2024)
Cost of living in Plymouth summary. We use data on the cost of living to determine how expensive it is to live in Plymouth. Real estate prices drive most of the variance in cost of living around Indiana. Key points include:
The cost of living in Plymouth is 84 with 100 being average.
The cost of living in Plymouth is 0.8x lower than the national average.
The median home value in Plymouth is $238,868.
The median income in Plymouth is $58,623.
Plymouth's Overall Cost Of Living
Lower Than The National Average
Cost Of Living In Plymouth Comparison Table
| Living Expense | Plymouth | Indiana | National Average |
|---|---|---|---|
| Overall | 84 | 90 | 100 |
| Services | 96 | 97 | 100 |
| Groceries | 101 | 95 | 100 |
| Health | 60 | 72 | 100 |
| Housing | 93 | 98 | 100 |
| Transportation | 97 | 94 | 100 |
| Utilities | 91 | 96 | 100 |
Source: Cost of living index, normalized to US average = 100
Plymouth, IN Weather
The average high in Plymouth is 59.5° and the average low is 40.2°.
There are 78.1 days of precipitation each year.
Expect an average of 40.1 inches of precipitation each year with 44.7 inches of snow.
| Stat | Plymouth |
|---|---|
| Average Annual High | 59.5 |
| Average Annual Low | 40.2 |
| Annual Precipitation Days | 78.1 |
| Average Annual Precipitation | 40.1 |
| Average Annual Snowfall | 44.7 |
Average High
Days of Rain
Source: NOAA climate normals (30-year)
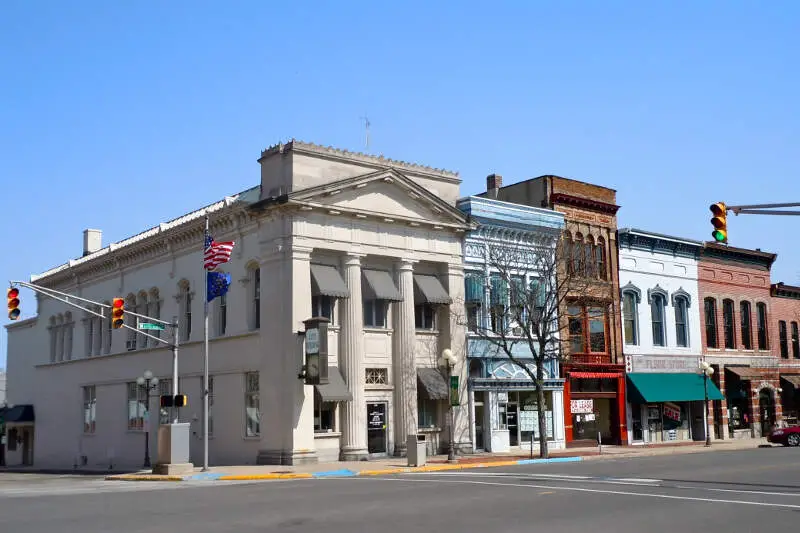
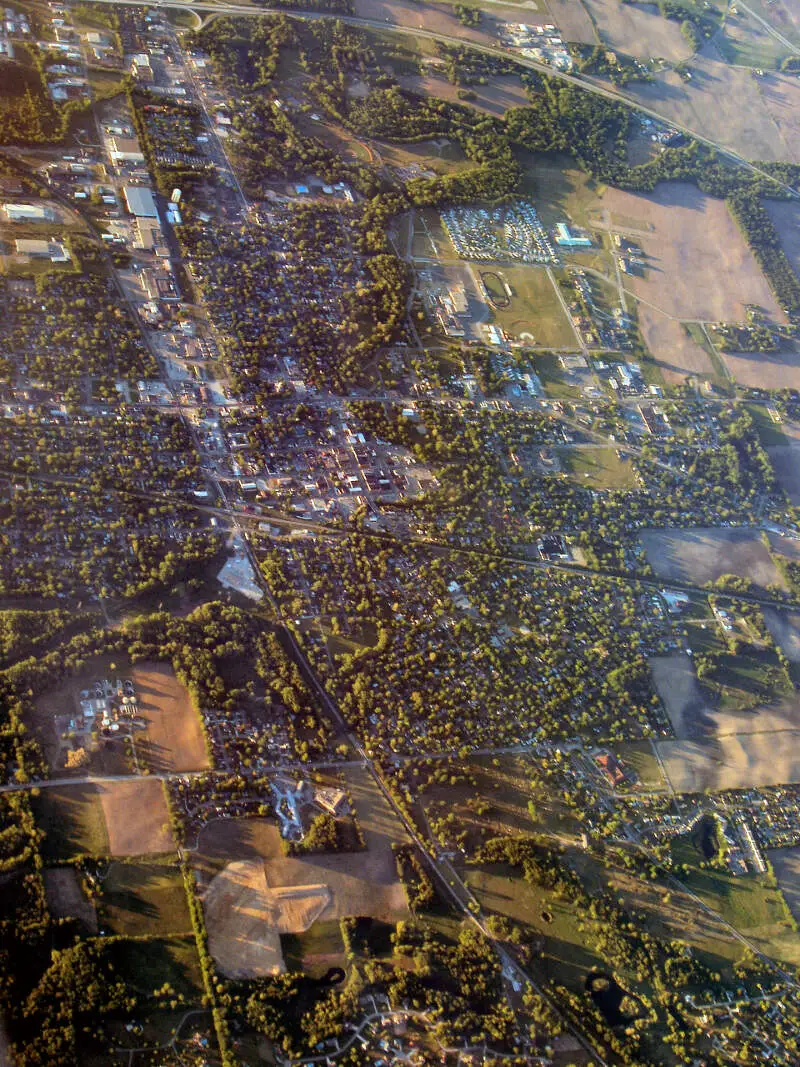
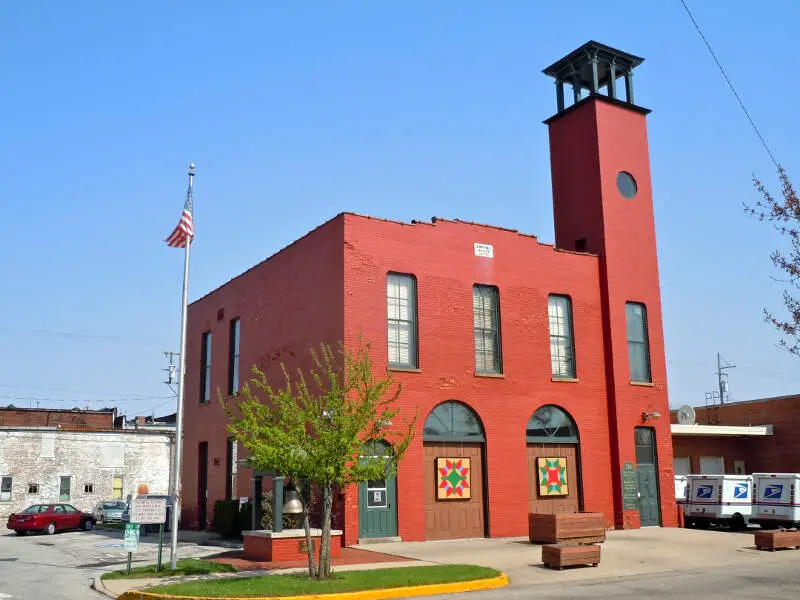
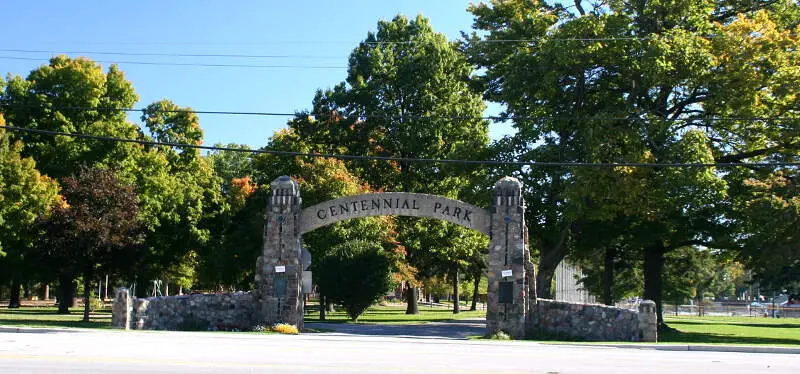
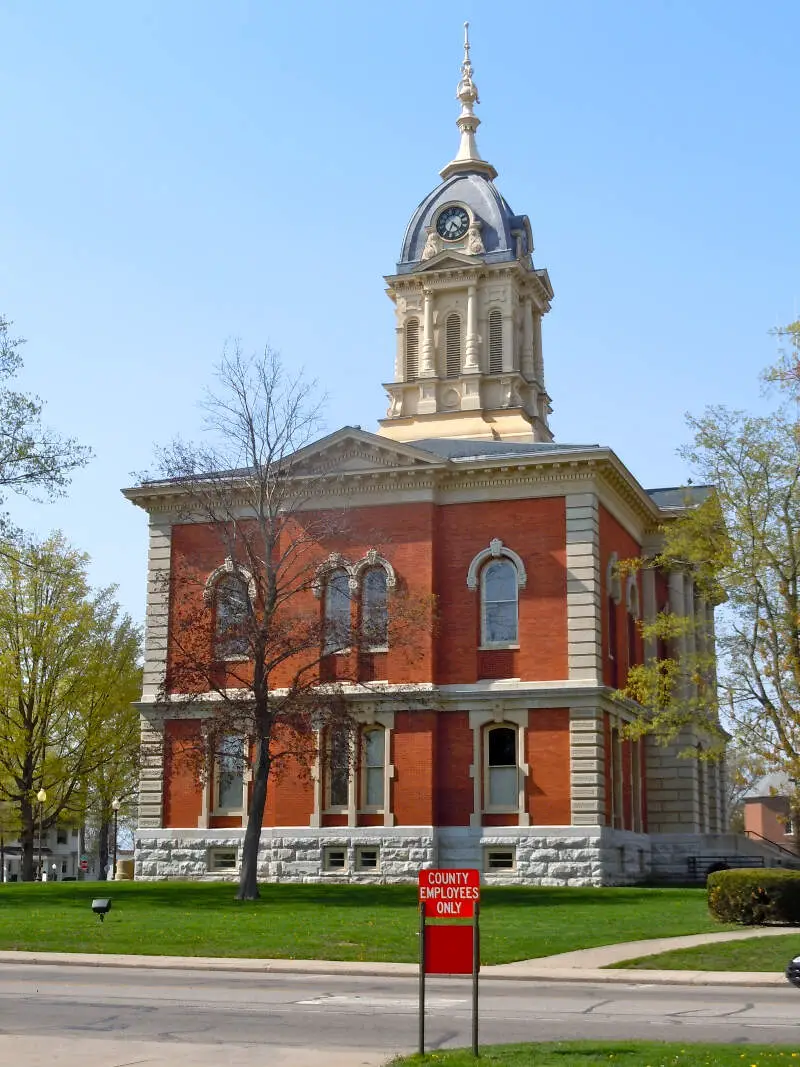
Plymouth, IN Photos
Rankings & Articles For Plymouth


Locations Around Plymouth
Map Of Plymouth, IN
Best Places Around Plymouth
Lakes of the Four Seasons, IN
Population 7,402
Dunlap, IN
Population 6,109
Nappanee, IN
Population 6,815
Granger, IN
Population 30,321
Westville, IN
Population 5,279
Goshen, IN
Population 34,420
Valparaiso, IN
Population 34,733
Chesterton, IN
Population 14,446
Warsaw, IN
Population 16,768
North Manchester, IN
Population 4,819
Plymouth Demographics And Statistics
Population over time in Plymouth
The current population in Plymouth is 10,664. The population has increased 6.2% from 2010.
| Year | Population | % Change |
|---|---|---|
| 2024 | 10,664 | 1.5% |
| 2023 | 10,506 | 1.3% |
| 2022 | 10,369 | 1.6% |
| 2021 | 10,209 | 1.8% |
| 2020 | 10,029 | -0.2% |
| 2019 | 10,054 | 0.6% |
| 2018 | 9,996 | -0.1% |
| 2017 | 10,011 | -0.0% |
| 2016 | 10,012 | -0.2% |
| 2015 | 10,031 | -0.2% |
| 2014 | 10,048 | 0.1% |
| 2013 | 10,040 | -0.0% |
| 2012 | 10,045 | -0.0% |
| 2011 | 10,047 | 0.0% |
| 2010 | 10,044 | - |
Race / Ethnicity in Plymouth
See the full breakdown
Plymouth is:
71.8% White with 7,656 White residents.
0.7% African American with 78 African American residents.
0.1% American Indian with 10 American Indian residents.
0.7% Asian with 78 Asian residents.
0.1% Hawaiian with 7 Hawaiian residents.
0.0% Other with 0 Other residents.
1.7% Two Or More with 176 Two Or More residents.
24.9% Hispanic with 2,659 Hispanic residents.
| Race | Plymouth | IN | USA |
|---|---|---|---|
| White | 71.8% | 75.4% | 57.4% |
| African American | 0.7% | 9.1% | 11.9% |
| American Indian | 0.1% | 0.1% | 0.5% |
| Asian | 0.7% | 2.6% | 5.9% |
| Hawaiian | 0.1% | 0.0% | 0.2% |
| Other | 0.0% | 0.4% | 0.6% |
| Two Or More | 1.7% | 3.8% | 4.3% |
| Hispanic | 24.9% | 8.6% | 19.3% |
Gender in Plymouth
See the full breakdown
Plymouth is 48.9% female with 5,215 female residents.
Plymouth is 51.1% male with 5,449 male residents.
| Gender | Plymouth | IN | USA |
|---|---|---|---|
| Female | 48.9% | 50.4% | 50.5% |
| Male | 51.1% | 49.6% | 49.5% |
Highest level of educational attainment in Plymouth for adults over 25
See the full breakdown
8.0% of adults in Plymouth completed < 9th grade.
9.0% of adults in Plymouth completed 9-12th grade.
35.0% of adults in Plymouth completed high school / ged.
17.0% of adults in Plymouth completed some college.
8.0% of adults in Plymouth completed associate's degree.
15.0% of adults in Plymouth completed bachelor's degree.
6.0% of adults in Plymouth completed master's degree.
2.0% of adults in Plymouth completed professional degree.
0.0% of adults in Plymouth completed doctorate degree.
| Education | Plymouth | IN | USA |
|---|---|---|---|
| < 9th Grade | 8.0% | 3.0% | 4.0% |
| 9-12th Grade | 9.0% | 6.0% | 6.0% |
| High School / GED | 35.0% | 33.0% | 26.0% |
| Some College | 17.0% | 19.0% | 19.0% |
| Associate's Degree | 8.0% | 9.0% | 9.0% |
| Bachelor's Degree | 15.0% | 19.0% | 22.0% |
| Master's Degree | 6.0% | 8.0% | 10.0% |
| Professional Degree | 2.0% | 2.0% | 2.0% |
| Doctorate Degree | 0.0% | 1.0% | 2.0% |
Household Income For Plymouth, Indiana
See the full breakdown
4.7% of households in Plymouth earn Less than $10,000.
4.8% of households in Plymouth earn $10,000 to $14,999.
6.1% of households in Plymouth earn $15,000 to $24,999.
6.8% of households in Plymouth earn $25,000 to $34,999.
17.1% of households in Plymouth earn $35,000 to $49,999.
23.0% of households in Plymouth earn $50,000 to $74,999.
16.6% of households in Plymouth earn $75,000 to $99,999.
13.8% of households in Plymouth earn $100,000 to $149,999.
5.1% of households in Plymouth earn $150,000 to $199,999.
2.0% of households in Plymouth earn $200,000 or more.
| Income | Plymouth | IN | USA |
|---|---|---|---|
| Less than $10,000 | 4.7% | 4.9% | 5.0% |
| $10,000 to $14,999 | 4.8% | 3.4% | 3.4% |
| $15,000 to $24,999 | 6.1% | 6.8% | 6.3% |
| $25,000 to $34,999 | 6.8% | 7.5% | 6.6% |
| $35,000 to $49,999 | 17.1% | 11.8% | 10.1% |
| $50,000 to $74,999 | 23.0% | 17.7% | 15.5% |
| $75,000 to $99,999 | 16.6% | 13.9% | 12.6% |
| $100,000 to $149,999 | 13.8% | 17.5% | 17.5% |
| $150,000 to $199,999 | 5.1% | 8.3% | 9.6% |
| $200,000 or more | 2.0% | 8.2% | 13.4% |
Source: U.S. Census ACS 5-year estimates (2024)


