Princeton SnackAbility
Overall SnackAbility
Cost of living in Princeton summary. We use data on the cost of living to determine how expensive it is to live in Princeton. Real estate prices drive most of the variance in cost of living around Indiana. Key points include:
The cost of living in Princeton is 86 with 100 being average.
The cost of living in Princeton is 0.9x lower than the national average.
The median home value in Princeton is $187,282.
The median income in Princeton is $57,618.
Princeton's Overall Cost Of Living
Lower Than The National Average
Cost Of Living In Princeton Comparison Table
| Living Expense | Princeton | Indiana | National Average |
|---|---|---|---|
| Overall | 86 | 90 | 100 |
| Services | 99 | 97 | 100 |
| Groceries | 92 | 95 | 100 |
| Health | 57 | 72 | 100 |
| Housing | 99 | 98 | 100 |
| Transportation | 94 | 94 | 100 |
| Utilities | 101 | 96 | 100 |
Source: Cost of living index, normalized to US average = 100
Princeton, IN Weather
The average high in Princeton is 65.9° and the average low is 45.6°.
There are 76.4 days of precipitation each year.
Expect an average of 46.3 inches of precipitation each year with 10.9 inches of snow.
| Stat | Princeton |
|---|---|
| Average Annual High | 65.9 |
| Average Annual Low | 45.6 |
| Annual Precipitation Days | 76.4 |
| Average Annual Precipitation | 46.3 |
| Average Annual Snowfall | 10.9 |
Average High
Days of Rain
Source: NOAA climate normals (30-year)
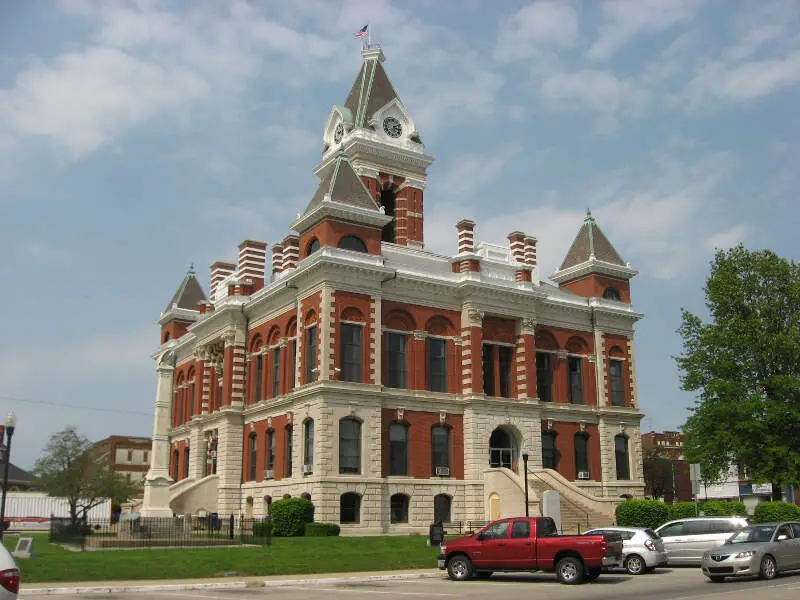
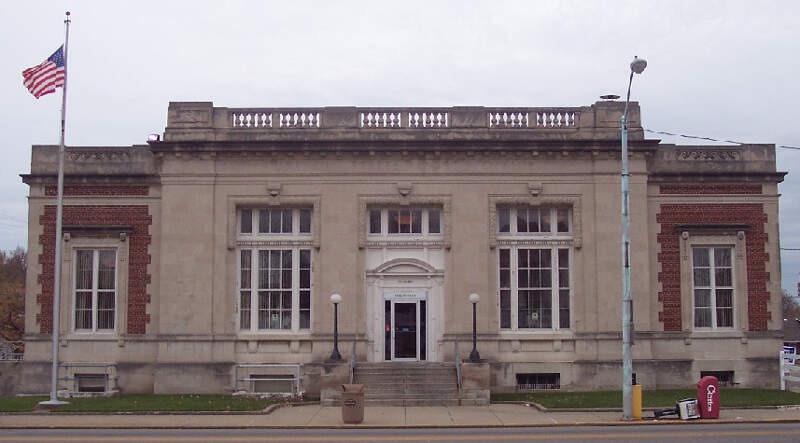
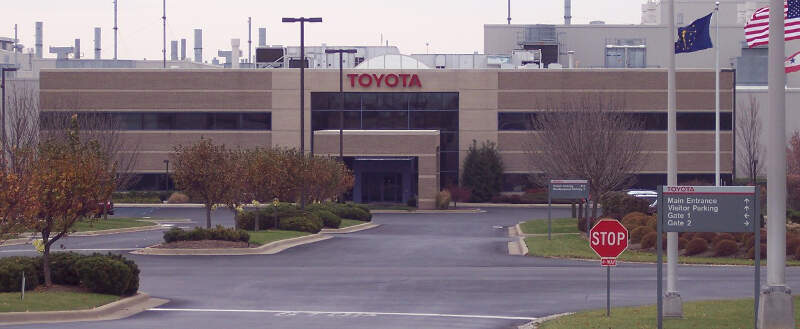
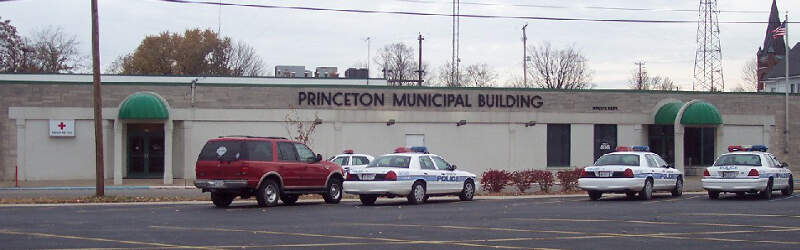
Princeton, IN Photos
Rankings & Articles For Princeton


Locations Around Princeton
Map Of Princeton, IN
Best Places Around Princeton
Carmi, IL
Population 4,845
Mount Carmel, IL
Population 6,854
Owensboro, KY
Population 60,302
Jasper, IN
Population 15,991
Robinson, IL
Population 7,084
Mount Vernon, IN
Population 6,400
Huntingburg, IN
Population 6,396
Morganfield, KY
Population 3,185
Princeton Demographics And Statistics
Population over time in Princeton
The current population in Princeton is 8,372. The population has decreased 3.0% from 2010.
| Year | Population | % Change |
|---|---|---|
| 2024 | 8,372 | 0.3% |
| 2023 | 8,347 | 0.0% |
| 2022 | 8,344 | 0.1% |
| 2021 | 8,337 | -4.3% |
| 2020 | 8,716 | 0.4% |
| 2019 | 8,684 | 0.7% |
| 2018 | 8,627 | 0.6% |
| 2017 | 8,573 | -0.5% |
| 2016 | 8,617 | -0.0% |
| 2015 | 8,618 | 0.2% |
| 2014 | 8,600 | -0.2% |
| 2013 | 8,620 | 0.2% |
| 2012 | 8,607 | -0.2% |
| 2011 | 8,625 | -0.1% |
| 2010 | 8,631 | - |
Race / Ethnicity in Princeton
See the full breakdown
Princeton is:
80.2% White with 6,718 White residents.
4.9% African American with 412 African American residents.
0.0% American Indian with 4 American Indian residents.
0.9% Asian with 77 Asian residents.
0.4% Hawaiian with 35 Hawaiian residents.
0.5% Other with 41 Other residents.
5.9% Two Or More with 490 Two Or More residents.
7.1% Hispanic with 595 Hispanic residents.
| Race | Princeton | IN | USA |
|---|---|---|---|
| White | 80.2% | 75.4% | 57.4% |
| African American | 4.9% | 9.1% | 11.9% |
| American Indian | 0.0% | 0.1% | 0.5% |
| Asian | 0.9% | 2.6% | 5.9% |
| Hawaiian | 0.4% | 0.0% | 0.2% |
| Other | 0.5% | 0.4% | 0.6% |
| Two Or More | 5.9% | 3.8% | 4.3% |
| Hispanic | 7.1% | 8.6% | 19.3% |
Gender in Princeton
See the full breakdown
Princeton is 46.9% female with 3,928 female residents.
Princeton is 53.1% male with 4,443 male residents.
| Gender | Princeton | IN | USA |
|---|---|---|---|
| Female | 46.9% | 50.4% | 50.5% |
| Male | 53.1% | 49.6% | 49.5% |
Highest level of educational attainment in Princeton for adults over 25
See the full breakdown
5.0% of adults in Princeton completed < 9th grade.
12.0% of adults in Princeton completed 9-12th grade.
48.0% of adults in Princeton completed high school / ged.
19.0% of adults in Princeton completed some college.
8.0% of adults in Princeton completed associate's degree.
6.0% of adults in Princeton completed bachelor's degree.
2.0% of adults in Princeton completed master's degree.
0.0% of adults in Princeton completed professional degree.
0.0% of adults in Princeton completed doctorate degree.
| Education | Princeton | IN | USA |
|---|---|---|---|
| < 9th Grade | 5.0% | 3.0% | 4.0% |
| 9-12th Grade | 12.0% | 6.0% | 6.0% |
| High School / GED | 48.0% | 33.0% | 26.0% |
| Some College | 19.0% | 19.0% | 19.0% |
| Associate's Degree | 8.0% | 9.0% | 9.0% |
| Bachelor's Degree | 6.0% | 19.0% | 22.0% |
| Master's Degree | 2.0% | 8.0% | 10.0% |
| Professional Degree | 0.0% | 2.0% | 2.0% |
| Doctorate Degree | 0.0% | 1.0% | 2.0% |
Household Income For Princeton, Indiana
See the full breakdown
5.0% of households in Princeton earn Less than $10,000.
3.5% of households in Princeton earn $10,000 to $14,999.
10.2% of households in Princeton earn $15,000 to $24,999.
13.1% of households in Princeton earn $25,000 to $34,999.
14.1% of households in Princeton earn $35,000 to $49,999.
17.9% of households in Princeton earn $50,000 to $74,999.
14.8% of households in Princeton earn $75,000 to $99,999.
11.8% of households in Princeton earn $100,000 to $149,999.
6.7% of households in Princeton earn $150,000 to $199,999.
3.0% of households in Princeton earn $200,000 or more.
| Income | Princeton | IN | USA |
|---|---|---|---|
| Less than $10,000 | 5.0% | 4.9% | 5.0% |
| $10,000 to $14,999 | 3.5% | 3.4% | 3.4% |
| $15,000 to $24,999 | 10.2% | 6.8% | 6.3% |
| $25,000 to $34,999 | 13.1% | 7.5% | 6.6% |
| $35,000 to $49,999 | 14.1% | 11.8% | 10.1% |
| $50,000 to $74,999 | 17.9% | 17.7% | 15.5% |
| $75,000 to $99,999 | 14.8% | 13.9% | 12.6% |
| $100,000 to $149,999 | 11.8% | 17.5% | 17.5% |
| $150,000 to $199,999 | 6.7% | 8.3% | 9.6% |
| $200,000 or more | 3.0% | 8.2% | 13.4% |
Source: U.S. Census ACS 5-year estimates (2024)


