Compare South Bend to…
South Bend SnackAbility
Overall SnackAbility
Crime in South Bend summary. We use data from the FBI to determine the crime rates in South Bend. Key points include:
There were 3,112 total crimes in South Bend in the last reporting year.
The overall crime rate per 100,000 people in South Bend is 3,009.2 / 100k people.
The violent crime rate per 100,000 people in South Bend is 965.0 / 100k people.
The property crime rate per 100,000 people in South Bend is 2,044.2 / 100k people.
Overall, crime in South Bend is 42.00% above the national average.
Total Crimes
Above National Average
Crime In South Bend Comparison Table
| Statistic | Count Raw |
South Bend / 100k People |
Indiana / 100k People |
National / 100k People |
|---|---|---|---|---|
| Total Crimes Per 100K | 3,112 | 3,009.2 | 1,691.5 | 2,119.2 |
| Violent Crime | 998 | 965.0 | 312.9 | 359.0 |
| Murder | 3 | 2.9 | 5.5 | 5.0 |
| Robbery | 70 | 67.7 | 34.5 | 61.0 |
| Aggravated Assault | 866 | 837.4 | 239.4 | 256.0 |
| Property Crime | 2,114 | 2,044.2 | 1,378.6 | 1,760.0 |
| Burglary | 238 | 230.1 | 176.8 | 229.0 |
| Larceny | 1,427 | 1,379.9 | 988.8 | 1,272.0 |
| Car Theft | 449 | 434.2 | 213.0 | 259.0 |
Source: FBI Uniform Crime Reporting (2024)
Cost of living in South Bend summary. We use data on the cost of living to determine how expensive it is to live in South Bend. Real estate prices drive most of the variance in cost of living around Indiana. Key points include:
The cost of living in South Bend is 85 with 100 being average.
The cost of living in South Bend is 0.8x lower than the national average.
The median home value in South Bend is $192,339.
The median income in South Bend is $55,786.
South Bend's Overall Cost Of Living
Lower Than The National Average
Cost Of Living In South Bend Comparison Table
| Living Expense | South Bend | Indiana | National Average |
|---|---|---|---|
| Overall | 85 | 90 | 100 |
| Services | 93 | 97 | 100 |
| Groceries | 99 | 95 | 100 |
| Health | 59 | 72 | 100 |
| Housing | 91 | 98 | 100 |
| Transportation | 98 | 94 | 100 |
| Utilities | 92 | 96 | 100 |
Source: Cost of living index, normalized to US average = 100
South Bend, IN Weather
The average high in South Bend is 59.1° and the average low is 40.2°.
There are 78.5 days of precipitation each year.
Expect an average of 39.3 inches of precipitation each year with 64.3 inches of snow.
| Stat | South Bend |
|---|---|
| Average Annual High | 59.1 |
| Average Annual Low | 40.2 |
| Annual Precipitation Days | 78.5 |
| Average Annual Precipitation | 39.3 |
| Average Annual Snowfall | 64.3 |
Average High
Days of Rain
Source: NOAA climate normals (30-year)
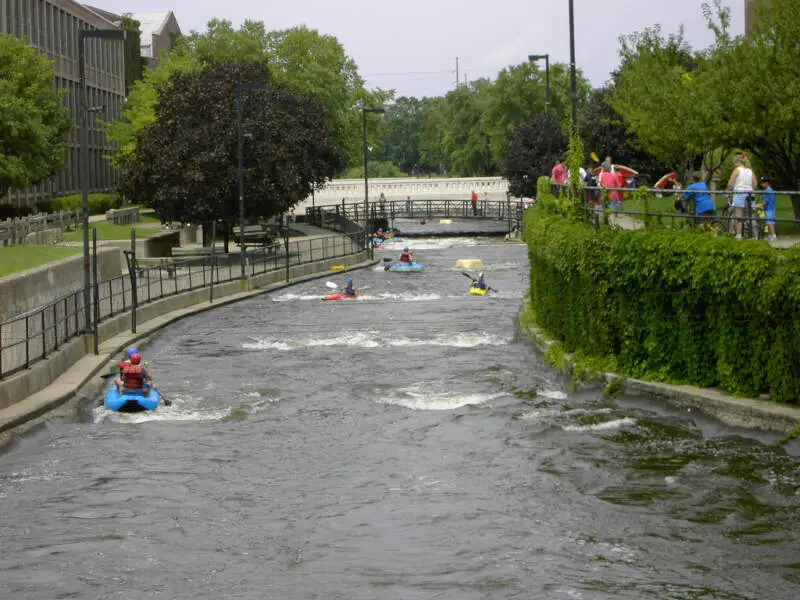
South Bend, IN Photos


6 Reviews & Comments About South Bend

Agree with south bend. I just moved here because of family. I live in a suburb but most of the commercial activity is in south bend/Mishawaka. People are boorish, uncultured. Work s***s here. Very political and they fire or lay off on a dime. Everyone from retail to mid level corporate have that p****d off attitude like they really don't want to be working here and are doing you a favor just by talking to you. Upper level management are all ganged up trying to save their jobs. Nothing to do here. Still stuck on that 'studebaker' mentality. As in boo hoo, the town went to s**t after studebaker closed factories in the 60's. Most of the south and west portions are run down, derelict, crime ridden. It saddens to see such poverty. White or black.
But it seems to be on the upswing with the new mayor. Resurgent downtown, northern part of sb and granger are good. Elkhart while still blue collar is doing well.
I live in Mishawaka so I know the real South Bend lol
Hey I live in south bend and it isn't that bad
South Bend, home of Notre Dame, is nothing like Notre Dame. It is an aging city with some seedy area. It does offer parks and theater, plus a great library system. I truly enjoyed the visit.
St. Patrick's Park along the St Joe River is a great place to explorer. There are multiple trails, with a clean environment. Downtown offers a variety of shops and a theater.
For me, the lack of sunshine really hits hard. 73 full sunny days. Their idea of party cloudy seems pretty cloudy to me. I have lived in 7 states now and South Bend, area is the most unfriendly I have ever lived. The economy is not good, It looses population every year 3 %. Terrible crime. They did fix up the down town are but once your outside of that it is a lot of blight in the area, dilapidated homes, boarded up. Not a pretty city by any means. It was very hard to find work, mostly a union town, homeless on many streets that hang out by the stoplights and intersections asking for money. I have never seen anything like that in my life.
Notre is cool and some historical housing. Not a good economy is the trouble, and the lack of sun is pretty bad.
Guys it's not that bad and it's actually really LGBT friendly! For one, our Mayor (Pete, you may have heard of him
They have first Fridays downtown every first Friday of a month and those are almost always a great time!
Art beat is a summer street fair held usually the first Friday of July. SUPER fun weekend.
Other fun summer activity's include our WHITE WATER RAFTING! pottery painting, the beautiful river lights, walking at our many parks or college campuses, or enjoying fresh fudge at our huge chocolate store!
The theater community is AMAZING! The Morris performing arts center hosts many professional touring shows and the local South Bend Civic Theater has OUTSTANDING productions and those are just two of the local theaters!
I rest my case.
Rankings & Articles For South Bend


Locations Around South Bend
Map Of South Bend, IN
Best Places Around South Bend
Dunlap, IN
Population 6,109
Granger, IN
Population 30,321
Niles, MI
Population 11,803
Mishawaka, IN
Population 51,021
Elkhart, IN
Population 53,733
South Bend Demographics And Statistics
Population over time in South Bend
The current population in South Bend is 103,085. The population has increased 1.0% from 2010.
| Year | Population | % Change |
|---|---|---|
| 2024 | 103,085 | 0.2% |
| 2023 | 102,866 | -0.2% |
| 2022 | 103,084 | 0.3% |
| 2021 | 102,786 | 0.1% |
| 2020 | 102,686 | 0.6% |
| 2019 | 102,037 | -0.2% |
| 2018 | 102,233 | 0.3% |
| 2017 | 101,928 | 0.9% |
| 2016 | 101,037 | 0.4% |
| 2015 | 100,590 | 0.2% |
| 2014 | 100,422 | -0.4% |
| 2013 | 100,863 | -0.4% |
| 2012 | 101,282 | -0.4% |
| 2011 | 101,708 | -0.4% |
| 2010 | 102,073 | - |
Race / Ethnicity in South Bend
See the full breakdown
South Bend is:
50.9% White with 52,501 White residents.
22.4% African American with 23,141 African American residents.
0.1% American Indian with 113 American Indian residents.
2.3% Asian with 2,364 Asian residents.
0.0% Hawaiian with 42 Hawaiian residents.
0.6% Other with 572 Other residents.
5.8% Two Or More with 5,949 Two Or More residents.
17.9% Hispanic with 18,403 Hispanic residents.
| Race | South Bend | IN | USA |
|---|---|---|---|
| White | 50.9% | 75.4% | 57.4% |
| African American | 22.4% | 9.1% | 11.9% |
| American Indian | 0.1% | 0.1% | 0.5% |
| Asian | 2.3% | 2.6% | 5.9% |
| Hawaiian | 0.0% | 0.0% | 0.2% |
| Other | 0.6% | 0.4% | 0.6% |
| Two Or More | 5.8% | 3.8% | 4.3% |
| Hispanic | 17.9% | 8.6% | 19.3% |
Gender in South Bend
See the full breakdown
South Bend is 52.1% female with 53,754 female residents.
South Bend is 47.9% male with 49,330 male residents.
| Gender | South Bend | IN | USA |
|---|---|---|---|
| Female | 52.1% | 50.4% | 50.5% |
| Male | 47.9% | 49.6% | 49.5% |
Highest level of educational attainment in South Bend for adults over 25
See the full breakdown
4.0% of adults in South Bend completed < 9th grade.
9.0% of adults in South Bend completed 9-12th grade.
31.0% of adults in South Bend completed high school / ged.
19.0% of adults in South Bend completed some college.
8.0% of adults in South Bend completed associate's degree.
17.0% of adults in South Bend completed bachelor's degree.
8.0% of adults in South Bend completed master's degree.
2.0% of adults in South Bend completed professional degree.
2.0% of adults in South Bend completed doctorate degree.
| Education | South Bend | IN | USA |
|---|---|---|---|
| < 9th Grade | 4.0% | 3.0% | 4.0% |
| 9-12th Grade | 9.0% | 6.0% | 6.0% |
| High School / GED | 31.0% | 33.0% | 26.0% |
| Some College | 19.0% | 19.0% | 19.0% |
| Associate's Degree | 8.0% | 9.0% | 9.0% |
| Bachelor's Degree | 17.0% | 19.0% | 22.0% |
| Master's Degree | 8.0% | 8.0% | 10.0% |
| Professional Degree | 2.0% | 2.0% | 2.0% |
| Doctorate Degree | 2.0% | 1.0% | 2.0% |
Household Income For South Bend, Indiana
See the full breakdown
7.1% of households in South Bend earn Less than $10,000.
5.7% of households in South Bend earn $10,000 to $14,999.
8.8% of households in South Bend earn $15,000 to $24,999.
9.9% of households in South Bend earn $25,000 to $34,999.
13.3% of households in South Bend earn $35,000 to $49,999.
19.5% of households in South Bend earn $50,000 to $74,999.
13.3% of households in South Bend earn $75,000 to $99,999.
13.5% of households in South Bend earn $100,000 to $149,999.
4.5% of households in South Bend earn $150,000 to $199,999.
4.4% of households in South Bend earn $200,000 or more.
| Income | South Bend | IN | USA |
|---|---|---|---|
| Less than $10,000 | 7.1% | 4.9% | 5.0% |
| $10,000 to $14,999 | 5.7% | 3.4% | 3.4% |
| $15,000 to $24,999 | 8.8% | 6.8% | 6.3% |
| $25,000 to $34,999 | 9.9% | 7.5% | 6.6% |
| $35,000 to $49,999 | 13.3% | 11.8% | 10.1% |
| $50,000 to $74,999 | 19.5% | 17.7% | 15.5% |
| $75,000 to $99,999 | 13.3% | 13.9% | 12.6% |
| $100,000 to $149,999 | 13.5% | 17.5% | 17.5% |
| $150,000 to $199,999 | 4.5% | 8.3% | 9.6% |
| $200,000 or more | 4.4% | 8.2% | 13.4% |
Source: U.S. Census ACS 5-year estimates (2024)


