Emporia SnackAbility
Overall SnackAbility
Crime in Emporia summary. We use data from the FBI to determine the crime rates in Emporia. Key points include:
There were 644 total crimes in Emporia in the last reporting year.
The overall crime rate per 100,000 people in Emporia is 2,671.2 / 100k people.
The violent crime rate per 100,000 people in Emporia is 369.2 / 100k people.
The property crime rate per 100,000 people in Emporia is 2,302.0 / 100k people.
Overall, crime in Emporia is 26.05% above the national average.
Total Crimes
Above National Average
Crime In Emporia Comparison Table
| Statistic | Count Raw |
Emporia / 100k People |
Kansas / 100k People |
National / 100k People |
|---|---|---|---|---|
| Total Crimes Per 100K | 644 | 2,671.2 | 2,395.1 | 2,119.2 |
| Violent Crime | 89 | 369.2 | 438.7 | 359.0 |
| Murder | 0 | 0.0 | 3.8 | 5.0 |
| Robbery | 4 | 16.6 | 30.9 | 61.0 |
| Aggravated Assault | 69 | 286.2 | 359.9 | 256.0 |
| Property Crime | 555 | 2,302.0 | 1,956.4 | 1,760.0 |
| Burglary | 104 | 431.4 | 261.6 | 229.0 |
| Larceny | 432 | 1,791.9 | 1,458.5 | 1,272.0 |
| Car Theft | 19 | 78.8 | 236.3 | 259.0 |
Source: FBI Uniform Crime Reporting (2024)
Cost of living in Emporia summary. We use data on the cost of living to determine how expensive it is to live in Emporia. Real estate prices drive most of the variance in cost of living around Kansas. Key points include:
The cost of living in Emporia is 84 with 100 being average.
The cost of living in Emporia is 0.8x lower than the national average.
The median home value in Emporia is $169,150.
The median income in Emporia is $52,704.
Emporia's Overall Cost Of Living
Lower Than The National Average
Cost Of Living In Emporia Comparison Table
| Living Expense | Emporia | Kansas | National Average |
|---|---|---|---|
| Overall | 84 | 91 | 100 |
| Services | 97 | 98 | 100 |
| Groceries | 96 | 97 | 100 |
| Health | 61 | 76 | 100 |
| Housing | 92 | 97 | 100 |
| Transportation | 97 | 93 | 100 |
| Utilities | 95 | 95 | 100 |
Source: Cost of living index, normalized to US average = 100
Emporia, KS Weather
The average high in Emporia is 66.2° and the average low is 44.2°.
There are 55.9 days of precipitation each year.
Expect an average of 37.5 inches of precipitation each year with 13.8 inches of snow.
| Stat | Emporia |
|---|---|
| Average Annual High | 66.2 |
| Average Annual Low | 44.2 |
| Annual Precipitation Days | 55.9 |
| Average Annual Precipitation | 37.5 |
| Average Annual Snowfall | 13.8 |
Average High
Days of Rain
Source: NOAA climate normals (30-year)
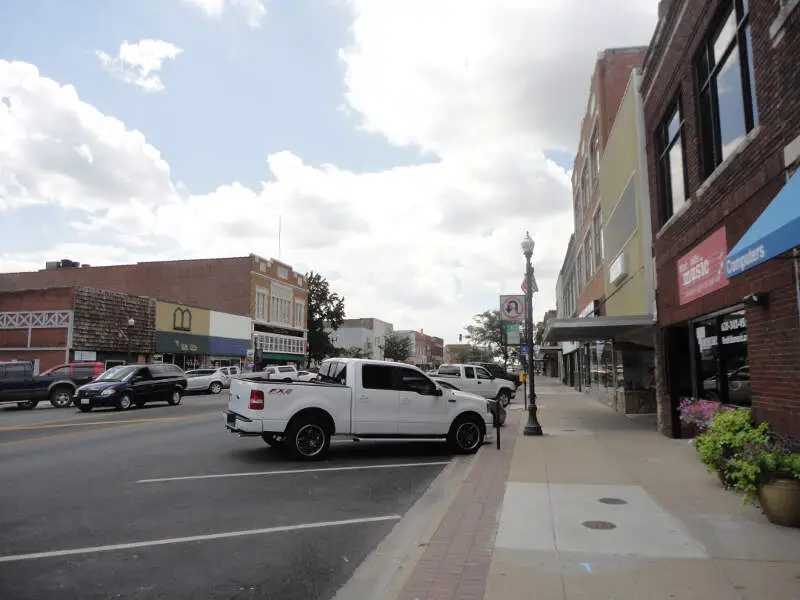
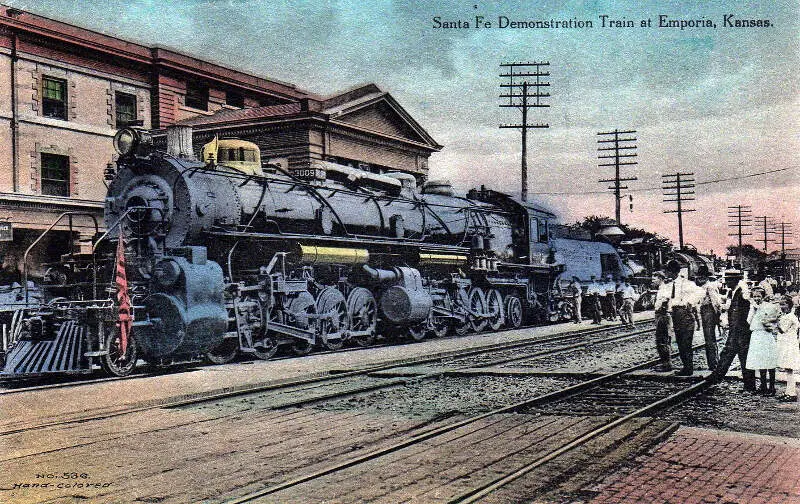
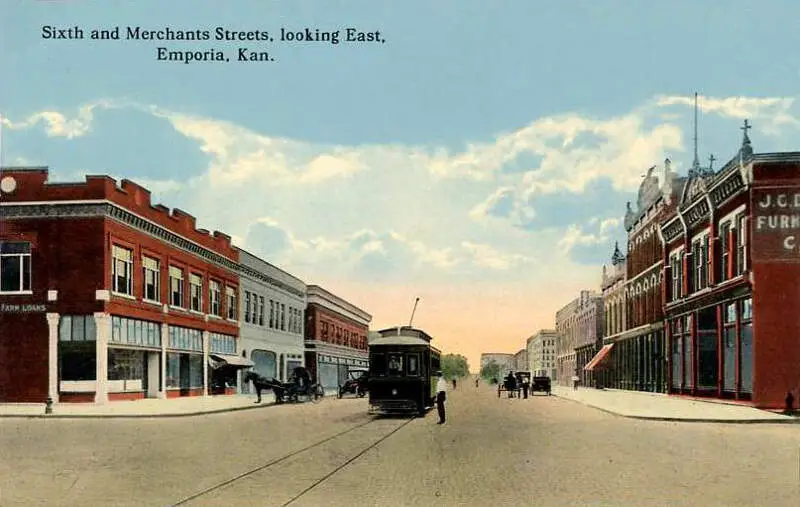
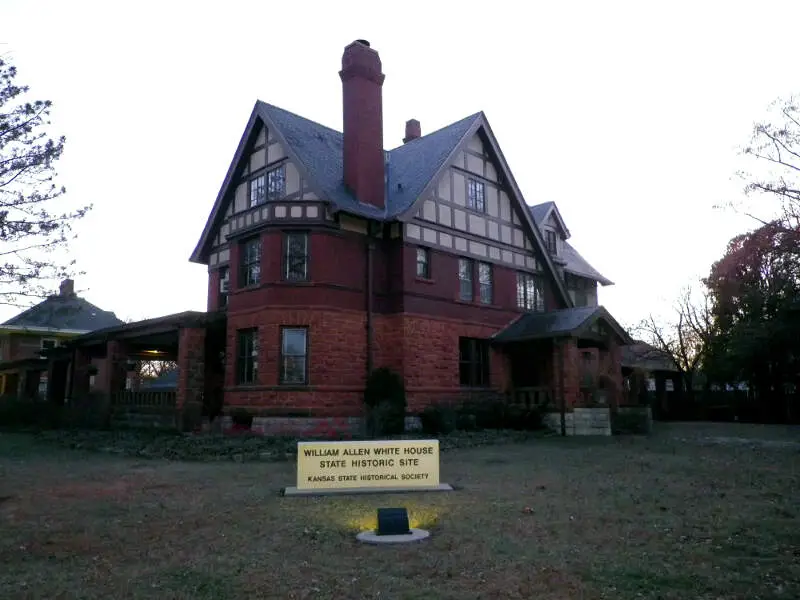
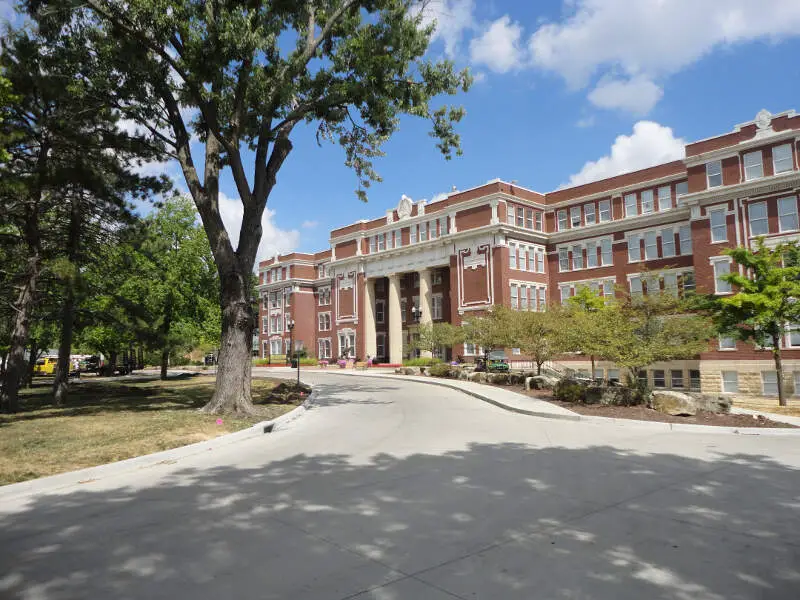
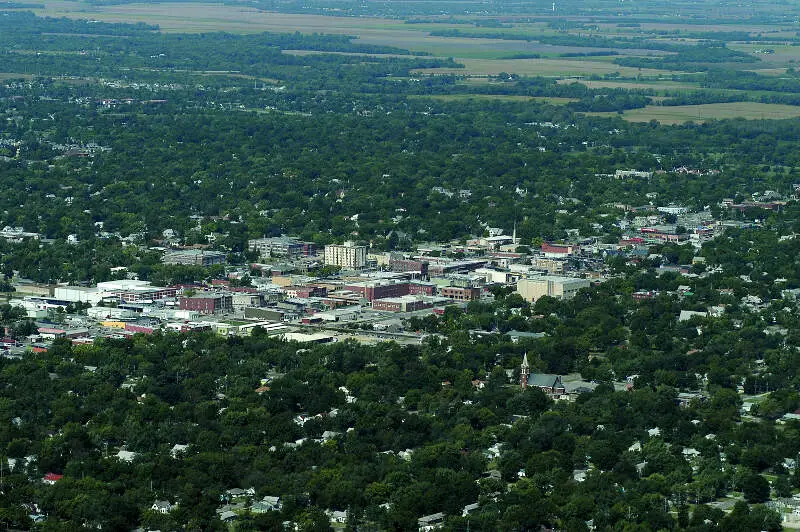
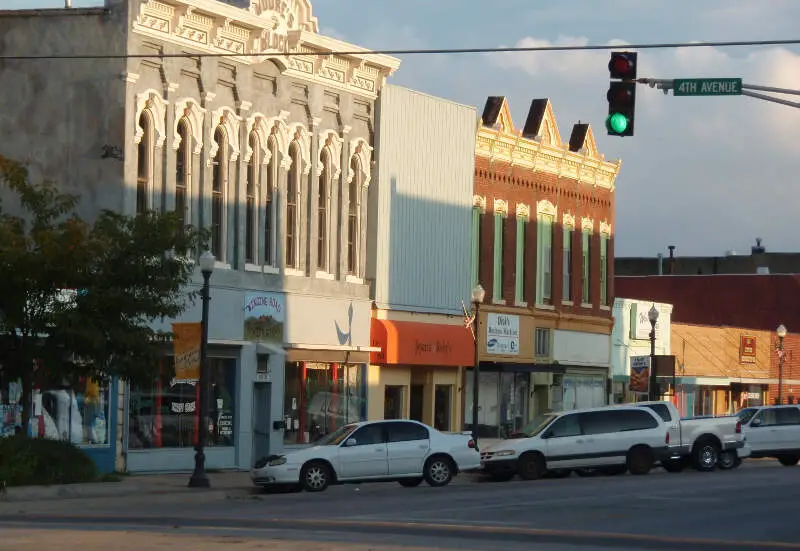
Emporia, KS Photos


1 Reviews & Comments About Emporia

lived in Emporia all of 2002-2003. Extremely safe. Huge and friendly police presence. I often walked all night in the summers and never felt even uneasy. Read a paper there sometime and you'll see how little and minor crime is there. It's a nice university town. What about all those poor falling apart towns in western Kansas.
Rankings & Articles For Emporia


Locations Around Emporia
Map Of Emporia, KS
Best Places Around Emporia
Emporia Demographics And Statistics
Population over time in Emporia
The current population in Emporia is 24,131. The population has decreased 7.0% from 2010.
| Year | Population | % Change |
|---|---|---|
| 2024 | 24,131 | 0.1% |
| 2023 | 24,098 | -0.1% |
| 2022 | 24,118 | -0.4% |
| 2021 | 24,220 | -1.7% |
| 2020 | 24,631 | 0.1% |
| 2019 | 24,607 | -0.2% |
| 2018 | 24,649 | 0.1% |
| 2017 | 24,636 | -0.3% |
| 2016 | 24,707 | -0.1% |
| 2015 | 24,739 | -0.2% |
| 2014 | 24,787 | -0.4% |
| 2013 | 24,895 | -1.4% |
| 2012 | 25,245 | -1.4% |
| 2011 | 25,612 | -1.3% |
| 2010 | 25,945 | - |
Race / Ethnicity in Emporia
See the full breakdown
Emporia is:
61.2% White with 14,765 White residents.
1.8% African American with 443 African American residents.
0.2% American Indian with 51 American Indian residents.
2.2% Asian with 529 Asian residents.
0.0% Hawaiian with 0 Hawaiian residents.
0.2% Other with 38 Other residents.
4.4% Two Or More with 1,054 Two Or More residents.
30.0% Hispanic with 7,251 Hispanic residents.
| Race | Emporia | KS | USA |
|---|---|---|---|
| White | 61.2% | 72.7% | 57.4% |
| African American | 1.8% | 5.2% | 11.9% |
| American Indian | 0.2% | 0.4% | 0.5% |
| Asian | 2.2% | 2.9% | 5.9% |
| Hawaiian | 0.0% | 0.1% | 0.2% |
| Other | 0.2% | 0.4% | 0.6% |
| Two Or More | 4.4% | 4.8% | 4.3% |
| Hispanic | 30.0% | 13.6% | 19.3% |
Gender in Emporia
See the full breakdown
Emporia is 51.6% female with 12,449 female residents.
Emporia is 48.4% male with 11,681 male residents.
| Gender | Emporia | KS | USA |
|---|---|---|---|
| Female | 51.6% | 49.8% | 50.5% |
| Male | 48.4% | 50.2% | 49.5% |
Highest level of educational attainment in Emporia for adults over 25
See the full breakdown
7.0% of adults in Emporia completed < 9th grade.
5.0% of adults in Emporia completed 9-12th grade.
36.0% of adults in Emporia completed high school / ged.
20.0% of adults in Emporia completed some college.
8.0% of adults in Emporia completed associate's degree.
14.0% of adults in Emporia completed bachelor's degree.
8.0% of adults in Emporia completed master's degree.
1.0% of adults in Emporia completed professional degree.
1.0% of adults in Emporia completed doctorate degree.
| Education | Emporia | KS | USA |
|---|---|---|---|
| < 9th Grade | 7.0% | 4.0% | 4.0% |
| 9-12th Grade | 5.0% | 5.0% | 6.0% |
| High School / GED | 36.0% | 25.0% | 26.0% |
| Some College | 20.0% | 22.0% | 19.0% |
| Associate's Degree | 8.0% | 9.0% | 9.0% |
| Bachelor's Degree | 14.0% | 22.0% | 22.0% |
| Master's Degree | 8.0% | 10.0% | 10.0% |
| Professional Degree | 1.0% | 2.0% | 2.0% |
| Doctorate Degree | 1.0% | 1.0% | 2.0% |
Household Income For Emporia, Kansas
See the full breakdown
5.8% of households in Emporia earn Less than $10,000.
3.6% of households in Emporia earn $10,000 to $14,999.
10.5% of households in Emporia earn $15,000 to $24,999.
10.6% of households in Emporia earn $25,000 to $34,999.
15.7% of households in Emporia earn $35,000 to $49,999.
22.9% of households in Emporia earn $50,000 to $74,999.
14.7% of households in Emporia earn $75,000 to $99,999.
10.9% of households in Emporia earn $100,000 to $149,999.
2.1% of households in Emporia earn $150,000 to $199,999.
3.4% of households in Emporia earn $200,000 or more.
| Income | Emporia | KS | USA |
|---|---|---|---|
| Less than $10,000 | 5.8% | 4.4% | 5.0% |
| $10,000 to $14,999 | 3.6% | 3.2% | 3.4% |
| $15,000 to $24,999 | 10.5% | 6.2% | 6.3% |
| $25,000 to $34,999 | 10.6% | 7.9% | 6.6% |
| $35,000 to $49,999 | 15.7% | 11.1% | 10.1% |
| $50,000 to $74,999 | 22.9% | 17.7% | 15.5% |
| $75,000 to $99,999 | 14.7% | 13.5% | 12.6% |
| $100,000 to $149,999 | 10.9% | 17.7% | 17.5% |
| $150,000 to $199,999 | 2.1% | 8.8% | 9.6% |
| $200,000 or more | 3.4% | 9.6% | 13.4% |
Source: U.S. Census ACS 5-year estimates (2024)


