We all love the biggest cities that the Sunflower State has to offer. You know the places like Wichita and Overland Park which make all the headlines.
But there are a bunch of other great large cities in Kansas that don't get as much love.
We're going to change that right now.
Using the most recent Census data, we can tell you about all the places in Kansas with a focus on the biggest. We update the data each year and this is our fourth time doing this.
The Largest Cities In Kansas For 2026:
You can click here to see a full table of the 100 biggest cities in Kansas, along with every other place over 1,000 people big. It is sortable by clicking on the headers.
Read on below to see more on the biggest cities. Or for more reading on places to live in Kansas, check out:
The 10 Biggest Cities In Kansas

/10
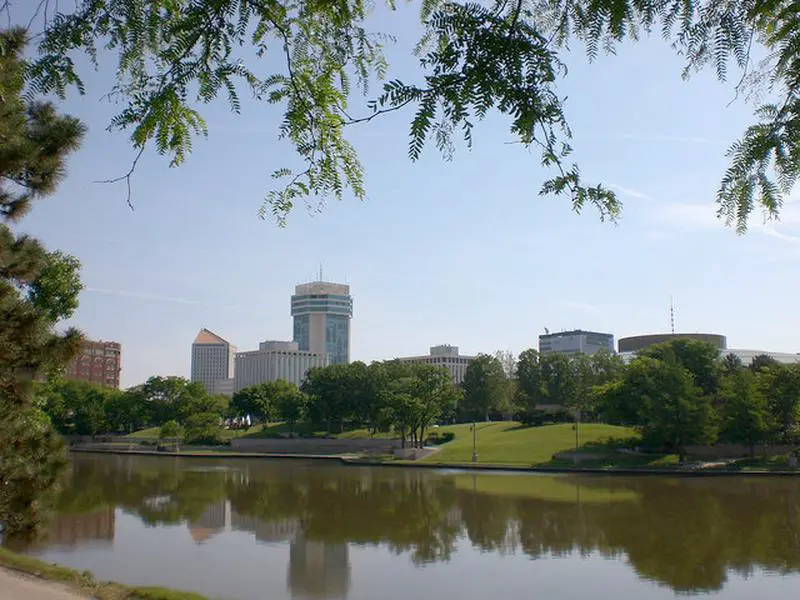
Rank Last Year: 1 (No Change)
Population: 397,945.0
Population 2010: 373,725
Growth: 6.5%
More on Wichita: Data | Crime | Cost Of Living | Real Estate

/10
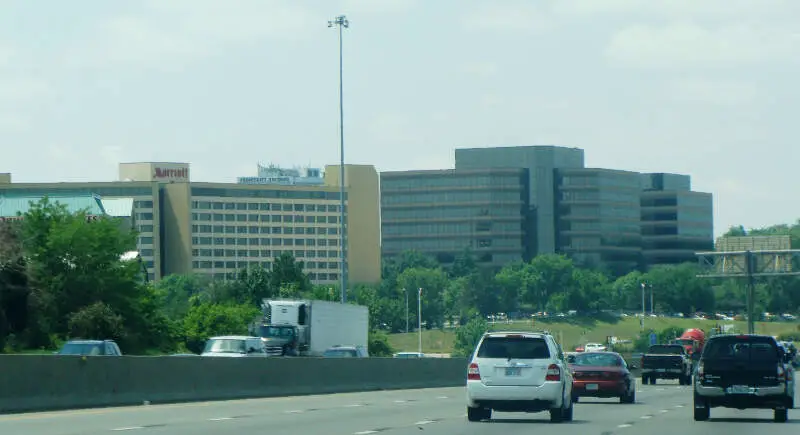
Rank Last Year: 2 (No Change)
Population: 200,306.0
Population 2010: 170,515
Growth: 17.5%
More on Overland Park: Data | Crime | Cost Of Living | Real Estate

/10
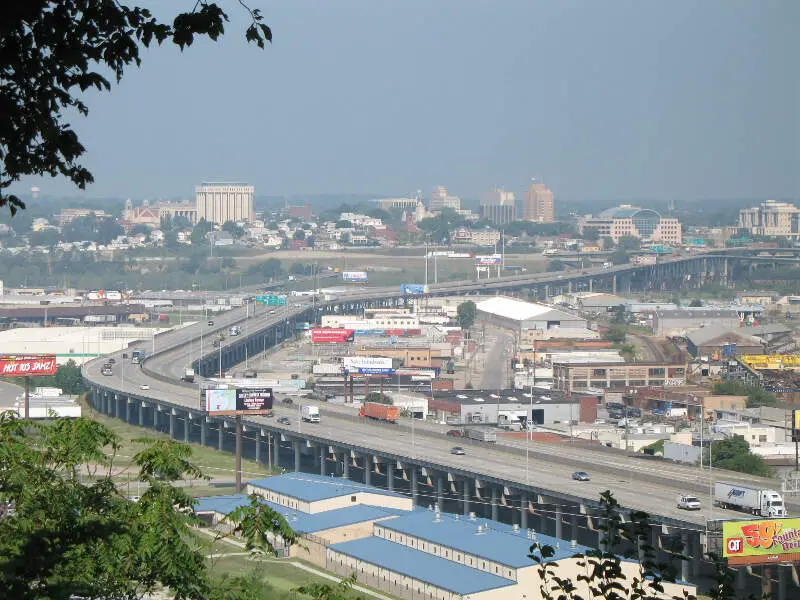
Rank Last Year: 3 (No Change)
Population: 155,135.0
Population 2010: 144,025
Growth: 7.7%
More on Kansas City: Data | Cost Of Living | Real Estate

/10
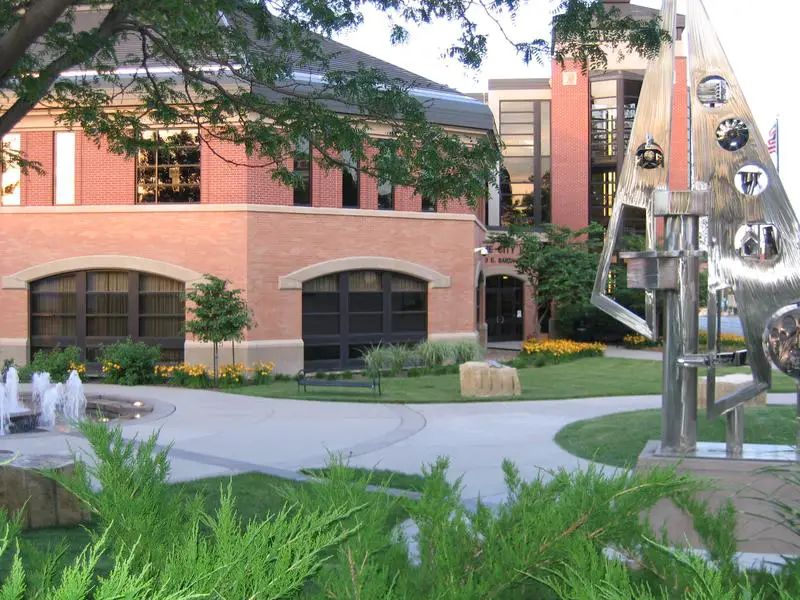
Rank Last Year: 4 (No Change)
Population: 145,057.0
Population 2010: 120,774
Growth: 20.1%
More on Olathe: Data | Crime | Cost Of Living | Real Estate

/10
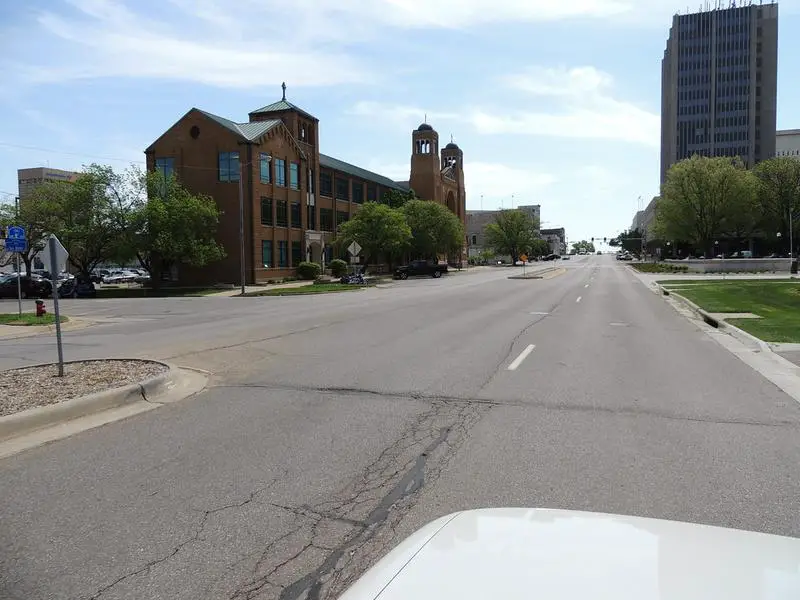
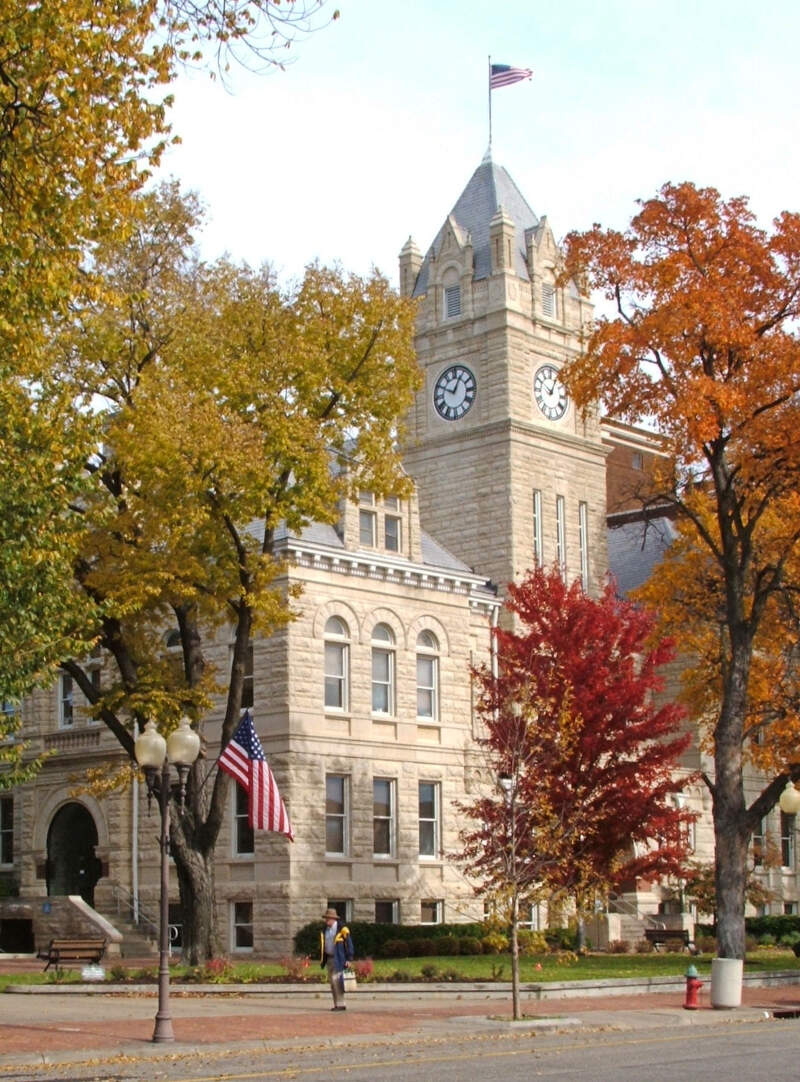
Rank Last Year: 5 (No Change)
Population: 125,786.0
Population 2010: 126,136
Growth: -0.3%
More on Topeka: Data | Crime | Cost Of Living | Real Estate

/10
Rank Last Year: 6 (No Change)
Population: 96,051.0
Population 2010: 86,426
Growth: 11.1%
More on Lawrence: Data | Cost Of Living | Real Estate


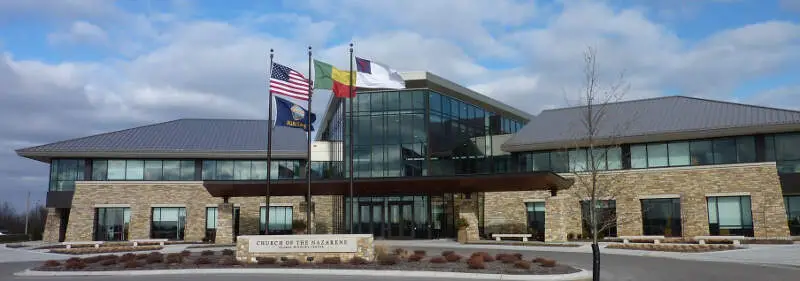
/10
Rank Last Year: 7 (No Change)
Population: 68,542.0
Population 2010: 60,066
Growth: 14.1%
More on Shawnee: Data | Crime | Cost Of Living | Real Estate

/10
Rank Last Year: 8 (No Change)
Population: 58,384.0
Population 2010: 47,089
Growth: 24.0%
More on Lenexa: Data | Crime | Cost Of Living | Real Estate

/10
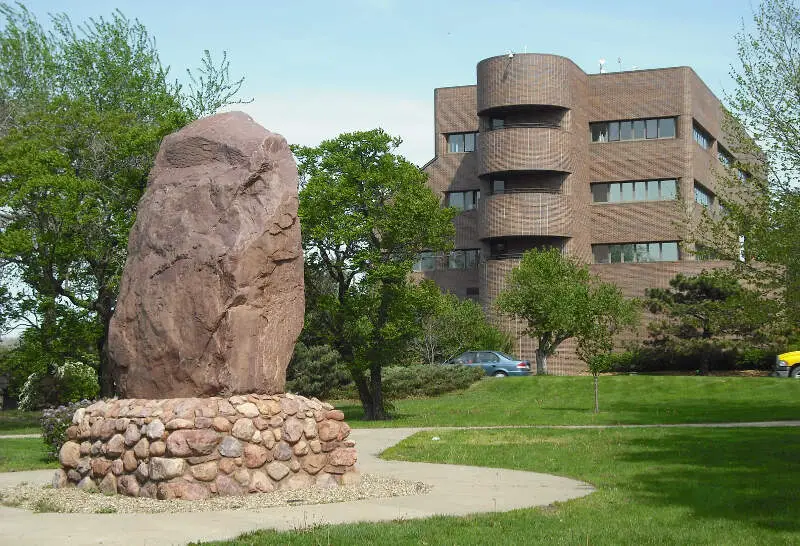
Rank Last Year: 9 (No Change)
Population: 54,239.0
Population 2010: 50,606
Growth: 7.2%
More on Manhattan: Data | Cost Of Living | Real Estate

/10
Rank Last Year: 10 (No Change)
Population: 46,307.0
Population 2010: 47,132
Growth: -1.8%
More on Salina: Data | Crime | Cost Of Living | Real Estate
How We Determined The Largest Cities In Kansas
We've been ranking and dissecting cities in the Sunflower State for over 4 years now -- making this actually the fourth time we've run the numbers. We always use the best data, the US Census. In this case, that means we are using the American Community Survey.
It what is probably the most simple analysis we run each year, we ranked every place in Kansas from biggest to smallest. The biggest city this year? That would be Wichita.
The smallest? Nickerson, although there are places smaller than 1,000 people not listed here, so keep that in mind as we take a look at the top ten.
Now on to numbers 11-100 Biggest in Kansas
We hope that you find the big city, or really any city, that's right for you. Below is a list of the rest of the biggest cities along with every other place in Kansas.
Have fun snacking around in the Sunflower State!
For more reading on Kansas, check out:
- Best Places To Retire In Kansas
- Richest Cities In Kansas
- Safest Places In Kansas
- Worst Places To Live In Kansas
Detailed List Of The Biggest Cities In Kansas
| Rank | City | Current Population | 2010 | Growth |
|---|---|---|---|---|
| 1 | Wichita | 397,945.0 | 373,725 | 6.5% |
| 2 | Overland Park | 200,306.0 | 170,515 | 17.5% |
| 3 | Kansas City | 155,135.0 | 144,025 | 7.7% |
| 4 | Olathe | 145,057.0 | 120,774 | 20.1% |
| 5 | Topeka | 125,786.0 | 126,136 | -0.3% |
| 6 | Lawrence | 96,051.0 | 86,426 | 11.1% |
| 7 | Shawnee | 68,542.0 | 60,066 | 14.1% |
| 8 | Lenexa | 58,384.0 | 47,089 | 24.0% |
| 9 | Manhattan | 54,239.0 | 50,606 | 7.2% |
| 10 | Salina | 46,307.0 | 47,132 | -1.8% |
| 11 | Hutchinson | 39,709.0 | 41,725 | -4.8% |
| 12 | Leavenworth | 37,195.0 | 35,174 | 5.7% |
| 13 | Leawood | 33,809.0 | 31,322 | 7.9% |
| 14 | Garden City | 27,819.0 | 26,050 | 6.8% |
| 15 | Dodge City | 27,613.0 | 26,298 | 5.0% |
| 16 | Derby | 26,062.0 | 20,909 | 24.6% |
| 17 | Gardner | 24,526.0 | 17,541 | 39.8% |
| 18 | Emporia | 24,131.0 | 25,945 | -7.0% |
| 19 | Prairie Village | 22,874.0 | 21,727 | 5.3% |
| 20 | Junction City | 22,331.0 | 20,742 | 7.7% |
| 21 | Hays | 21,143.0 | 20,259 | 4.4% |
| 22 | Pittsburg | 20,637.0 | 20,060 | 2.9% |
| 23 | Liberal | 19,316.0 | 20,308 | -4.9% |
| 24 | Newton | 18,397.0 | 18,769 | -2.0% |
| 25 | Andover | 15,965.0 | 10,993 | 45.2% |
| 26 | Great Bend | 14,479.0 | 15,726 | -7.9% |
| 27 | Mcpherson | 13,995.0 | 13,263 | 5.5% |
| 28 | El Dorado | 12,769.0 | 13,004 | -1.8% |
| 29 | Ottawa | 12,678.0 | 12,552 | 1.0% |
| 30 | Arkansas City | 11,884.0 | 12,296 | -3.4% |
| 31 | Winfield | 11,711.0 | 12,270 | -4.6% |
| 32 | Lansing | 11,246.0 | 10,961 | 2.6% |
| 33 | Haysville | 11,117.0 | 10,345 | 7.5% |
| 34 | Merriam | 11,085.0 | 11,107 | -0.2% |
| 35 | Atchison | 10,785.0 | 10,949 | -1.5% |
| 36 | Mission | 9,915.0 | 9,484 | 4.5% |
| 37 | Parsons | 9,425.0 | 10,661 | -11.6% |
| 38 | Augusta | 9,216.0 | 9,149 | 0.7% |
| 39 | Spring Hill | 9,120.0 | 4,948 | 84.3% |
| 40 | Bel Aire | 9,043.0 | 6,583 | 37.4% |
| 41 | Coffeyville | 8,662.0 | 10,380 | -16.6% |
| 42 | Fort Riley | 8,606.0 | 8,423 | 2.2% |
| 43 | Chanute | 8,598.0 | 9,141 | -5.9% |
| 44 | Valley Center | 8,590.0 | 6,748 | 27.3% |
| 45 | Independence | 8,422.0 | 9,505 | -11.4% |
| 46 | Bonner Springs | 7,839.0 | 7,112 | 10.2% |
| 47 | Park City | 7,673.0 | 7,044 | 8.9% |
| 48 | Wellington | 7,615.0 | 8,186 | -7.0% |
| 49 | Fort Scott | 7,555.0 | 8,125 | -7.0% |
| 50 | Basehor | 7,491.0 | 4,192 | 78.7% |
| 51 | Maize | 6,824.0 | 3,076 | 121.8% |
| 52 | Roeland Park | 6,763.0 | 6,875 | -1.6% |
| 53 | Pratt | 6,577.0 | 6,836 | -3.8% |
| 54 | Abilene | 6,449.0 | 6,785 | -5.0% |
| 55 | De Soto | 6,414.0 | 5,553 | 15.5% |
| 56 | Mulvane | 6,171.0 | 6,291 | -1.9% |
| 57 | Eudora | 6,119.0 | 6,063 | 0.9% |
| 58 | Goddard | 6,030.0 | 4,094 | 47.3% |
| 59 | Tonganoxie | 5,891.0 | 4,609 | 27.8% |
| 60 | Paola | 5,770.0 | 5,523 | 4.5% |
| 61 | Ulysses | 5,476.0 | 5,902 | -7.2% |
| 62 | Colby | 5,387.0 | 5,267 | 2.3% |
| 63 | Iola | 5,348.0 | 5,790 | -7.6% |
| 64 | Louisburg | 5,094.0 | 4,019 | 26.7% |
| 65 | Concordia | 5,015.0 | 5,379 | -6.8% |
| 66 | Baldwin City | 4,911.0 | 4,331 | 13.4% |
| 67 | Edwardsville | 4,724.0 | 4,253 | 11.1% |
| 68 | Wamego | 4,386.0 | 4,346 | 0.9% |
| 69 | Rose Hill | 4,246.0 | 3,948 | 7.5% |
| 70 | Russell | 4,217.0 | 4,375 | -3.6% |
| 71 | Osawatomie | 4,182.0 | 4,509 | -7.3% |
| 72 | Fairway | 4,159.0 | 3,911 | 6.3% |
| 73 | Clay Center | 4,132.0 | 4,350 | -5.0% |
| 74 | Goodland | 4,121.0 | 4,257 | -3.2% |
| 75 | Hugoton | 3,974.0 | 3,971 | 0.1% |
| 76 | Baxter Springs | 3,855.0 | 4,294 | -10.2% |
| 77 | Scott City | 3,800.0 | 3,782 | 0.5% |
| 78 | Lindsborg | 3,792.0 | 3,418 | 10.9% |
| 79 | Hesston | 3,582.0 | 3,776 | -5.1% |
| 80 | Lyons | 3,553.0 | 3,729 | -4.7% |
| 81 | Mission Hills | 3,548.0 | 3,549 | -0.0% |
| 82 | Larned | 3,423.0 | 4,012 | -14.7% |
| 83 | Marysville | 3,422.0 | 3,270 | 4.6% |
| 84 | Frontenac | 3,392.0 | 3,366 | 0.8% |
| 85 | Holton | 3,387.0 | 3,343 | 1.3% |
| 86 | Garnett | 3,202.0 | 3,409 | -6.1% |
| 87 | Hiawatha | 3,197.0 | 3,203 | -0.2% |
| 88 | Ellsworth | 3,108.0 | 3,081 | 0.9% |
| 89 | Beloit | 3,029.0 | 3,814 | -20.6% |
| 90 | Kingman | 2,957.0 | 3,198 | -7.5% |
| 91 | Kechi | 2,901.0 | 1,941 | 49.5% |
| 92 | Columbus | 2,881.0 | 3,328 | -13.4% |
| 93 | Osage City | 2,828.0 | 2,965 | -4.6% |
| 94 | Oaklawn-Sunview | 2,789.0 | 2,935 | -5.0% |
| 95 | St. Marys | 2,788.0 | 2,789 | -0.0% |
| 96 | Girard | 2,777.0 | 2,786 | -0.3% |
| 97 | Galena | 2,754.0 | 3,114 | -11.6% |
| 98 | South Hutchinson | 2,751.0 | 2,431 | 13.2% |
| 99 | Clearwater | 2,716.0 | 2,465 | 10.2% |
| 100 | Hillsboro | 2,700.0 | 2,958 | -8.7% |
| 101 | Norton | 2,689.0 | 2,909 | -7.6% |
| 102 | Hoisington | 2,643.0 | 2,728 | -3.1% |
| 103 | Burlington | 2,605.0 | 2,678 | -2.7% |
| 104 | Cheney | 2,580.0 | 1,804 | 43.0% |
| 105 | Holcomb | 2,577.0 | 1,764 | 46.1% |
| 106 | Halstead | 2,516.0 | 2,080 | 21.0% |
| 107 | Neodesha | 2,503.0 | 2,333 | 7.3% |
| 108 | Sabetha | 2,471.0 | 2,564 | -3.6% |
| 109 | Sterling | 2,411.0 | 2,204 | 9.4% |
| 110 | Council Grove | 2,265.0 | 2,368 | -4.3% |
| 111 | Anthony | 2,246.0 | 2,392 | -6.1% |
| 112 | Lakin | 2,243.0 | 2,373 | -5.5% |
| 113 | Eureka | 2,223.0 | 2,669 | -16.7% |
| 114 | Wellsville | 2,216.0 | 2,056 | 7.8% |
| 115 | Ellinwood | 2,192.0 | 1,818 | 20.6% |
| 116 | Ellis | 2,189.0 | 1,914 | 14.4% |
| 117 | Herington | 2,164.0 | 2,522 | -14.2% |
| 118 | North Newton | 2,155.0 | 1,679 | 28.4% |
| 119 | Phillipsburg | 2,130.0 | 2,567 | -17.0% |
| 120 | Cherryvale | 2,096.0 | 2,648 | -20.8% |
| 121 | Westwood | 2,093.0 | 1,518 | 37.9% |
| 122 | Seneca | 2,090.0 | 1,973 | 5.9% |
| 123 | Belleville | 2,086.0 | 2,164 | -3.6% |
| 124 | Minneapolis | 2,043.0 | 1,969 | 3.8% |
| 125 | Grandview Plaza | 2,015.0 | 939 | 114.6% |
| 126 | Oakley | 2,009.0 | 1,958 | 2.6% |
| 127 | Cimarron | 1,949.0 | 2,025 | -3.8% |
| 128 | Fredonia | 1,945.0 | 2,623 | -25.8% |
| 129 | Oswego | 1,937.0 | 2,133 | -9.2% |
| 130 | Edgerton | 1,924.0 | 1,682 | 14.4% |
| 131 | Mcconnell Afb | 1,907.0 | 1,713 | 11.3% |
| 132 | Wakeeney | 1,852.0 | 1,895 | -2.3% |
| 133 | Humboldt | 1,793.0 | 1,928 | -7.0% |
| 134 | Marion | 1,746.0 | 2,002 | -12.8% |
| 135 | Oberlin | 1,734.0 | 1,775 | -2.3% |
| 136 | Syracuse | 1,699.0 | 1,766 | -3.8% |
| 137 | Ogden | 1,696.0 | 1,808 | -6.2% |
| 138 | Smith Center | 1,680.0 | 1,692 | -0.7% |
| 139 | Towanda | 1,668.0 | 1,659 | 0.5% |
| 140 | Elkhart | 1,661.0 | 2,198 | -24.4% |
| 141 | Plainville | 1,656.0 | 1,546 | 7.1% |
| 142 | Stockton | 1,656.0 | 1,479 | 12.0% |
| 143 | Moundridge | 1,628.0 | 1,667 | -2.3% |
| 144 | Sedgwick | 1,614.0 | 1,559 | 3.5% |
| 145 | Horton | 1,610.0 | 1,870 | -13.9% |
| 146 | Douglass | 1,603.0 | 1,956 | -18.0% |
| 147 | Medicine Lodge | 1,578.0 | 1,955 | -19.3% |
| 148 | Conway Springs | 1,573.0 | 1,502 | 4.7% |
| 149 | Wathena | 1,554.0 | 1,454 | 6.9% |
| 150 | Silver Lake | 1,553.0 | 1,691 | -8.2% |
| 151 | Johnson City | 1,549.0 | 1,373 | 12.8% |
| 152 | Buhler | 1,525.0 | 1,324 | 15.2% |
| 153 | Pleasanton | 1,516.0 | 1,159 | 30.8% |
| 154 | Hill City | 1,511.0 | 1,603 | -5.7% |
| 155 | Sublette | 1,500.0 | 1,602 | -6.4% |
| 156 | Colwich | 1,492.0 | 1,223 | 22.0% |
| 157 | Chapman | 1,454.0 | 1,414 | 2.8% |
| 158 | Belle Plaine | 1,449.0 | 1,717 | -15.6% |
| 159 | Caney | 1,431.0 | 1,593 | -10.2% |
| 160 | Valley Falls | 1,382.0 | 1,251 | 10.5% |
| 161 | Leoti | 1,360.0 | 1,548 | -12.1% |
| 162 | Osborne | 1,358.0 | 1,462 | -7.1% |
| 163 | Meade | 1,341.0 | 1,647 | -18.6% |
| 164 | Carbondale | 1,341.0 | 1,507 | -11.0% |
| 165 | Kinsley | 1,328.0 | 1,694 | -21.6% |
| 166 | La Cygne | 1,327.0 | 1,503 | -11.7% |
| 167 | Inman | 1,325.0 | 1,388 | -4.5% |
| 168 | Atwood | 1,320.0 | 1,032 | 27.9% |
| 169 | Haven | 1,313.0 | 1,170 | 12.2% |
| 170 | Yates Center | 1,270.0 | 1,416 | -10.3% |
| 171 | Arma | 1,239.0 | 1,469 | -15.7% |
| 172 | St. Francis | 1,229.0 | 1,393 | -11.8% |
| 173 | Erie | 1,216.0 | 1,208 | 0.7% |
| 174 | Peabody | 1,196.0 | 1,616 | -26.0% |
| 175 | St. John | 1,172.0 | 1,375 | -14.8% |
| 176 | Plains | 1,171.0 | 1,071 | 9.3% |
| 177 | Ness City | 1,162.0 | 1,449 | -19.8% |
| 178 | Washington | 1,155.0 | 1,098 | 5.2% |
| 179 | La Crosse | 1,154.0 | 1,339 | -13.8% |
| 180 | Auburn | 1,144.0 | 1,184 | -3.4% |
| 181 | Harper | 1,136.0 | 1,338 | -15.1% |
| 182 | Garden Plain | 1,126.0 | 856 | 31.5% |
| 183 | Overbrook | 1,113.0 | 1,104 | 0.8% |
| 184 | Oskaloosa | 1,113.0 | 1,228 | -9.4% |
| 185 | Rossville | 1,106.0 | 1,073 | 3.1% |
| 186 | Victoria | 1,095.0 | 1,227 | -10.8% |
| 187 | Pomona | 1,088.0 | 852 | 27.7% |
| 188 | Highland | 1,069.0 | 901 | 18.6% |
| 189 | Perry | 1,069.0 | 1,076 | -0.7% |
| 190 | Alma | 1,063.0 | 898 | 18.4% |
| 191 | Andale | 1,062.0 | 919 | 15.6% |
| 192 | Sedan | 1,050.0 | 1,597 | -34.3% |
| 193 | Elwood | 1,049.0 | 1,149 | -8.7% |
| 194 | Burlingame | 1,046.0 | 960 | 9.0% |
| 195 | Hoxie | 1,042.0 | 1,278 | -18.5% |
| 196 | Cottonwood Falls | 1,041.0 | 1,042 | -0.1% |
| 197 | St. George | 1,039.0 | 611 | 70.0% |
| 198 | Wakefield | 1,031.0 | 971 | 6.2% |
| 199 | Lyndon | 1,023.0 | 1,037 | -1.4% |
| 200 | Lincoln Center | 1,017.0 | 1,393 | -27.0% |
| 201 | Galva | 1,002.0 | 872 | 14.9% |
| 202 | Nickerson | 1,001.0 | 1,167 | -14.2% |