Kansas City SnackAbility
Overall SnackAbility
Cost of living in Kansas City summary. We use data on the cost of living to determine how expensive it is to live in Kansas City. Real estate prices drive most of the variance in cost of living around Kansas. Key points include:
The cost of living in Kansas City is 86 with 100 being average.
The cost of living in Kansas City is 0.9x lower than the national average.
The median home value in Kansas City is $198,194.
The median income in Kansas City is $62,401.
Kansas City's Overall Cost Of Living
Lower Than The National Average
Cost Of Living In Kansas City Comparison Table
| Living Expense | Kansas City | Kansas | National Average |
|---|---|---|---|
| Overall | 86 | 91 | 100 |
| Services | 100 | 98 | 100 |
| Groceries | 95 | 97 | 100 |
| Health | 64 | 76 | 100 |
| Housing | 97 | 97 | 100 |
| Transportation | 94 | 93 | 100 |
| Utilities | 94 | 95 | 100 |
Source: Cost of living index, normalized to US average = 100
Kansas City, KS Weather
The average high in Kansas City is 65.5° and the average low is 45.4°.
There are 63.8 days of precipitation each year.
Expect an average of 40.1 inches of precipitation each year with 15.0 inches of snow.
| Stat | Kansas City |
|---|---|
| Average Annual High | 65.5 |
| Average Annual Low | 45.4 |
| Annual Precipitation Days | 63.8 |
| Average Annual Precipitation | 40.1 |
| Average Annual Snowfall | 15.0 |
Average High
Days of Rain
Source: NOAA climate normals (30-year)
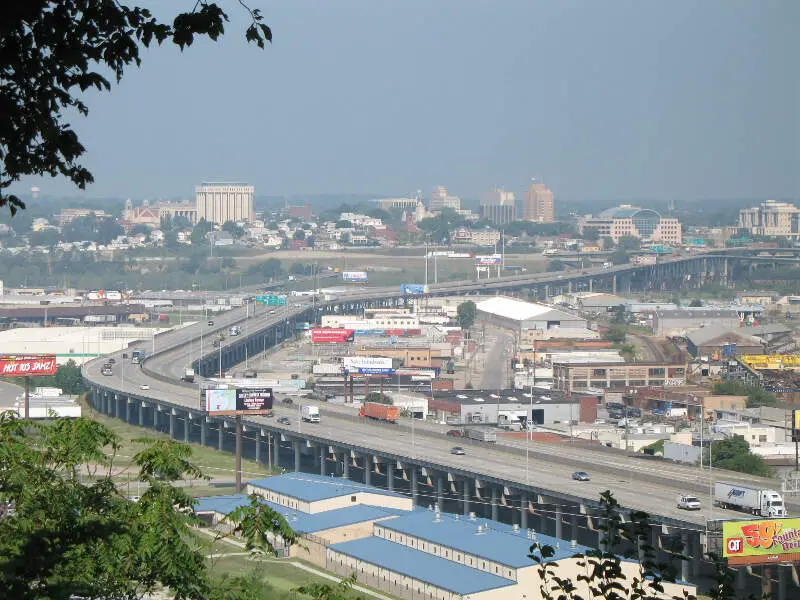
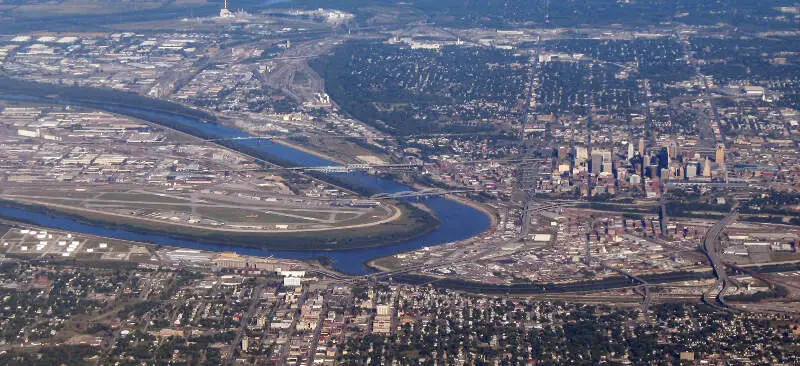
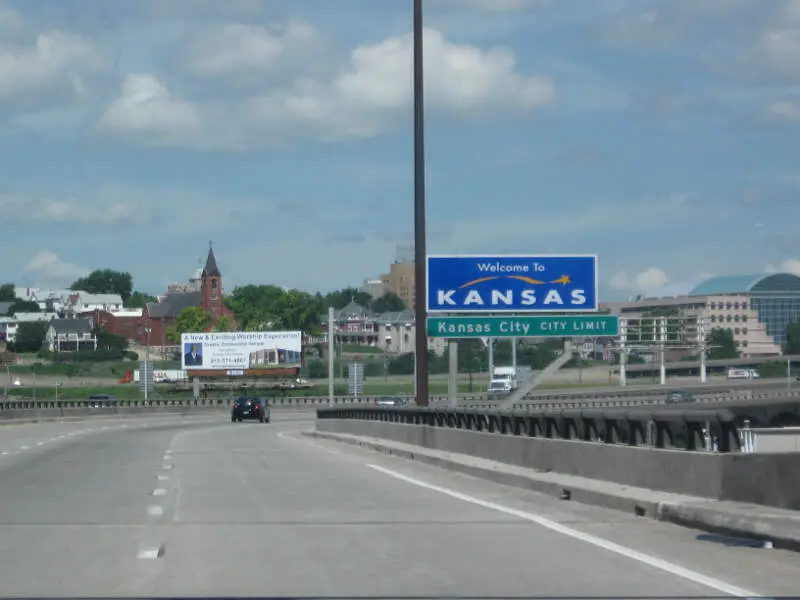
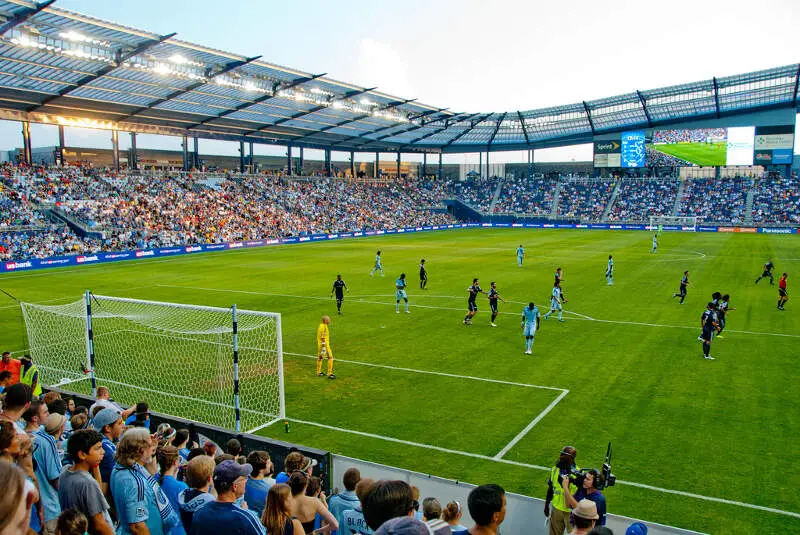
Kansas City, KS Photos

2 Reviews & Comments About Kansas City

The arts scene is expanding at an incredibly rapid pace. Lots of great museums, theater events, and festivals that are all quite accessible for those that look for it. The foodie scene is quite similar. A lot of great restaurants, and being surrounded by so much farmland allows for some fantatic farm-to-table opportunities. The cost of living there is great. I know that it allows to live a lot larger than I possibly could in a bigger city, and also allows me the opportunity to travel, People are generally friendly.
The food scene in Kansas is amazing. Kansas City is considered by many to be the undisputed king of barbecue cities in the world and they have more than 100 barbecue joints, so the adventure of trying something new is something we will never tire of. They also have an excellent combination of farm and table concepts and chefs acclaimed nationally and it was what I liked most about this city.
Very dangerous don't go out at night especially in Wyandotte county
Watch out for the thugs along the street corners they will kill
Rankings & Articles For Kansas City


Locations Around Kansas City
Map Of Kansas City, KS
Best Places Around Kansas City
Kansas City Demographics And Statistics
Population over time in Kansas City
The current population in Kansas City is 155,135. The population has increased 7.7% from 2010.
| Year | Population | % Change |
|---|---|---|
| 2024 | 155,135 | 0.2% |
| 2023 | 154,776 | -0.4% |
| 2022 | 155,438 | -0.2% |
| 2021 | 155,745 | 1.8% |
| 2020 | 153,014 | 0.3% |
| 2019 | 152,522 | 0.3% |
| 2018 | 152,069 | 0.7% |
| 2017 | 151,042 | 0.9% |
| 2016 | 149,755 | 0.6% |
| 2015 | 148,855 | 0.9% |
| 2014 | 147,598 | 0.7% |
| 2013 | 146,581 | 0.7% |
| 2012 | 145,605 | 0.6% |
| 2011 | 144,797 | 0.5% |
| 2010 | 144,025 | - |
Race / Ethnicity in Kansas City
See the full breakdown
Kansas City is:
33.7% White with 52,276 White residents.
19.2% African American with 29,794 African American residents.
0.3% American Indian with 410 American Indian residents.
5.3% Asian with 8,245 Asian residents.
0.2% Hawaiian with 339 Hawaiian residents.
0.6% Other with 1,006 Other residents.
4.9% Two Or More with 7,664 Two Or More residents.
35.7% Hispanic with 55,401 Hispanic residents.
| Race | Kansas City | KS | USA |
|---|---|---|---|
| White | 33.7% | 72.7% | 57.4% |
| African American | 19.2% | 5.2% | 11.9% |
| American Indian | 0.3% | 0.4% | 0.5% |
| Asian | 5.3% | 2.9% | 5.9% |
| Hawaiian | 0.2% | 0.1% | 0.2% |
| Other | 0.6% | 0.4% | 0.6% |
| Two Or More | 4.9% | 4.8% | 4.3% |
| Hispanic | 35.7% | 13.6% | 19.3% |
Gender in Kansas City
See the full breakdown
Kansas City is 49.8% female with 77,234 female residents.
Kansas City is 50.2% male with 77,900 male residents.
| Gender | Kansas City | KS | USA |
|---|---|---|---|
| Female | 49.8% | 49.8% | 50.5% |
| Male | 50.2% | 50.2% | 49.5% |
Highest level of educational attainment in Kansas City for adults over 25
See the full breakdown
10.0% of adults in Kansas City completed < 9th grade.
9.0% of adults in Kansas City completed 9-12th grade.
32.0% of adults in Kansas City completed high school / ged.
20.0% of adults in Kansas City completed some college.
8.0% of adults in Kansas City completed associate's degree.
13.0% of adults in Kansas City completed bachelor's degree.
6.0% of adults in Kansas City completed master's degree.
1.0% of adults in Kansas City completed professional degree.
1.0% of adults in Kansas City completed doctorate degree.
| Education | Kansas City | KS | USA |
|---|---|---|---|
| < 9th Grade | 10.0% | 4.0% | 4.0% |
| 9-12th Grade | 9.0% | 5.0% | 6.0% |
| High School / GED | 32.0% | 25.0% | 26.0% |
| Some College | 20.0% | 22.0% | 19.0% |
| Associate's Degree | 8.0% | 9.0% | 9.0% |
| Bachelor's Degree | 13.0% | 22.0% | 22.0% |
| Master's Degree | 6.0% | 10.0% | 10.0% |
| Professional Degree | 1.0% | 2.0% | 2.0% |
| Doctorate Degree | 1.0% | 1.0% | 2.0% |
Household Income For Kansas City, Kansas
See the full breakdown
6.0% of households in Kansas City earn Less than $10,000.
4.8% of households in Kansas City earn $10,000 to $14,999.
7.2% of households in Kansas City earn $15,000 to $24,999.
9.5% of households in Kansas City earn $25,000 to $34,999.
12.4% of households in Kansas City earn $35,000 to $49,999.
18.9% of households in Kansas City earn $50,000 to $74,999.
13.9% of households in Kansas City earn $75,000 to $99,999.
16.9% of households in Kansas City earn $100,000 to $149,999.
5.7% of households in Kansas City earn $150,000 to $199,999.
4.7% of households in Kansas City earn $200,000 or more.
| Income | Kansas City | KS | USA |
|---|---|---|---|
| Less than $10,000 | 6.0% | 4.4% | 5.0% |
| $10,000 to $14,999 | 4.8% | 3.2% | 3.4% |
| $15,000 to $24,999 | 7.2% | 6.2% | 6.3% |
| $25,000 to $34,999 | 9.5% | 7.9% | 6.6% |
| $35,000 to $49,999 | 12.4% | 11.1% | 10.1% |
| $50,000 to $74,999 | 18.9% | 17.7% | 15.5% |
| $75,000 to $99,999 | 13.9% | 13.5% | 12.6% |
| $100,000 to $149,999 | 16.9% | 17.7% | 17.5% |
| $150,000 to $199,999 | 5.7% | 8.8% | 9.6% |
| $200,000 or more | 4.7% | 9.6% | 13.4% |
Source: U.S. Census ACS 5-year estimates (2024)


