Lansing SnackAbility
Overall SnackAbility
Crime in Lansing summary. We use data from the FBI to determine the crime rates in Lansing. Key points include:
There were 84 total crimes in Lansing in the last reporting year.
The overall crime rate per 100,000 people in Lansing is 748.9 / 100k people.
The violent crime rate per 100,000 people in Lansing is 151.6 / 100k people.
The property crime rate per 100,000 people in Lansing is 597.4 / 100k people.
Overall, crime in Lansing is -64.66% below the national average.
Total Crimes
Below National Average
Crime In Lansing Comparison Table
| Statistic | Count Raw |
Lansing / 100k People |
Kansas / 100k People |
National / 100k People |
|---|---|---|---|---|
| Total Crimes Per 100K | 84 | 748.9 | 2,395.1 | 2,119.2 |
| Violent Crime | 17 | 151.6 | 438.7 | 359.0 |
| Murder | 0 | 0.0 | 3.8 | 5.0 |
| Robbery | 0 | 0.0 | 30.9 | 61.0 |
| Aggravated Assault | 10 | 89.2 | 359.9 | 256.0 |
| Property Crime | 67 | 597.4 | 1,956.4 | 1,760.0 |
| Burglary | 5 | 44.6 | 261.6 | 229.0 |
| Larceny | 57 | 508.2 | 1,458.5 | 1,272.0 |
| Car Theft | 5 | 44.6 | 236.3 | 259.0 |
Source: FBI Uniform Crime Reporting (2024)
Cost of living in Lansing summary. We use data on the cost of living to determine how expensive it is to live in Lansing. Real estate prices drive most of the variance in cost of living around Kansas. Key points include:
The cost of living in Lansing is 100 with 100 being average.
The cost of living in Lansing is 1.0x lower than the national average.
The median home value in Lansing is $321,293.
The median income in Lansing is $102,786.
Lansing's Overall Cost Of Living
Lower Than The National Average
Cost Of Living In Lansing Comparison Table
| Living Expense | Lansing | Kansas | National Average |
|---|---|---|---|
| Overall | 100 | 91 | 100 |
| Services | 97 | 98 | 100 |
| Groceries | 96 | 97 | 100 |
| Health | 104 | 76 | 100 |
| Housing | 100 | 97 | 100 |
| Transportation | 95 | 93 | 100 |
| Utilities | 95 | 95 | 100 |
Source: Cost of living index, normalized to US average = 100
Lansing, KS Weather
The average high in Lansing is 65.2° and the average low is 44.8°.
There are 63.3 days of precipitation each year.
Expect an average of 39.6 inches of precipitation each year with 17.2 inches of snow.
| Stat | Lansing |
|---|---|
| Average Annual High | 65.2 |
| Average Annual Low | 44.8 |
| Annual Precipitation Days | 63.3 |
| Average Annual Precipitation | 39.6 |
| Average Annual Snowfall | 17.2 |
Average High
Days of Rain
Source: NOAA climate normals (30-year)
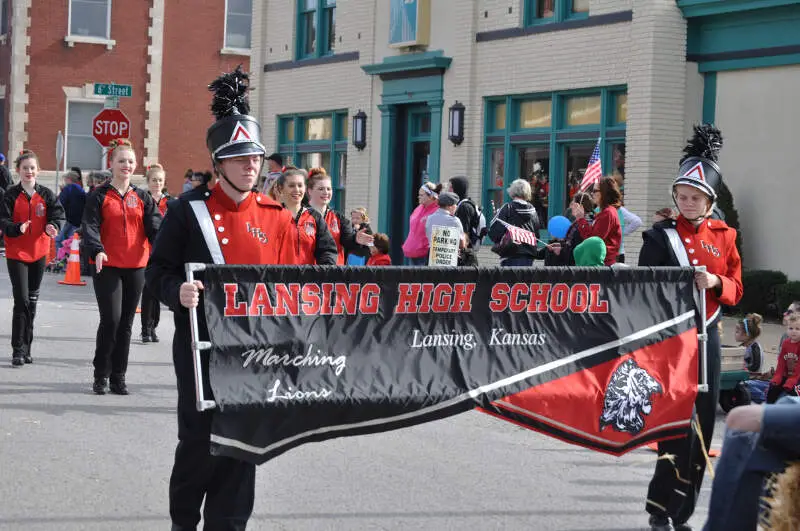
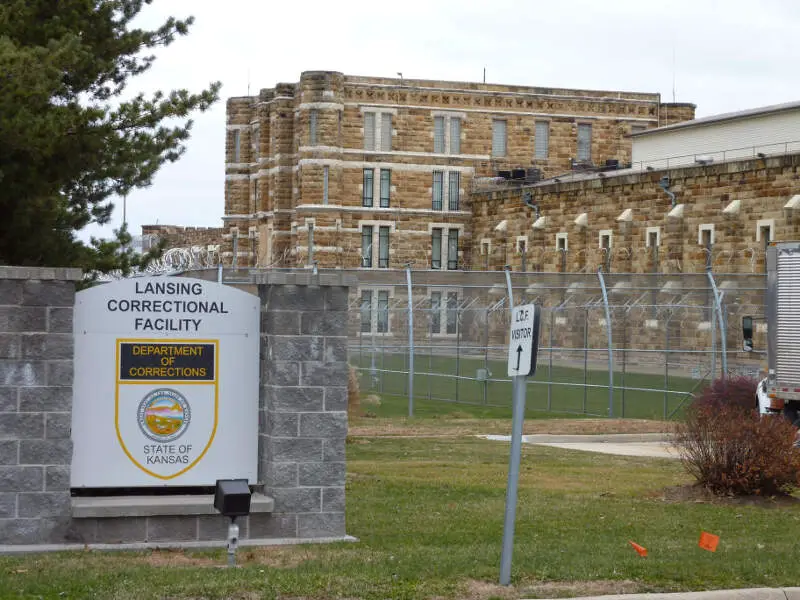
Lansing, KS Photos
Rankings & Articles For Lansing


Locations Around Lansing
Map Of Lansing, KS
Best Places Around Lansing
Parkville, MO
Population 8,366
Lenexa, KS
Population 58,384
Shawnee, KS
Population 68,542
Gladstone, MO
Population 27,207
Basehor, KS
Population 7,491
De Soto, KS
Population 6,414
Roeland Park, KS
Population 6,763
Merriam, KS
Population 11,085
Edwardsville, KS
Population 4,724
Mission, KS
Population 9,915
Lansing Demographics And Statistics
Population over time in Lansing
The current population in Lansing is 11,246. The population has increased 2.6% from 2010.
| Year | Population | % Change |
|---|---|---|
| 2024 | 11,246 | 0.2% |
| 2023 | 11,229 | -0.2% |
| 2022 | 11,254 | -0.6% |
| 2021 | 11,321 | -5.3% |
| 2020 | 11,955 | 0.5% |
| 2019 | 11,900 | 0.5% |
| 2018 | 11,835 | 0.5% |
| 2017 | 11,771 | 0.6% |
| 2016 | 11,706 | 0.7% |
| 2015 | 11,623 | 0.8% |
| 2014 | 11,535 | 1.1% |
| 2013 | 11,411 | 1.3% |
| 2012 | 11,260 | 1.3% |
| 2011 | 11,117 | 1.4% |
| 2010 | 10,961 | - |
Race / Ethnicity in Lansing
See the full breakdown
Lansing is:
70.1% White with 7,888 White residents.
9.6% African American with 1,085 African American residents.
0.1% American Indian with 15 American Indian residents.
1.4% Asian with 157 Asian residents.
1.7% Hawaiian with 192 Hawaiian residents.
0.4% Other with 47 Other residents.
9.5% Two Or More with 1,063 Two Or More residents.
7.1% Hispanic with 799 Hispanic residents.
| Race | Lansing | KS | USA |
|---|---|---|---|
| White | 70.1% | 72.7% | 57.4% |
| African American | 9.6% | 5.2% | 11.9% |
| American Indian | 0.1% | 0.4% | 0.5% |
| Asian | 1.4% | 2.9% | 5.9% |
| Hawaiian | 1.7% | 0.1% | 0.2% |
| Other | 0.4% | 0.4% | 0.6% |
| Two Or More | 9.5% | 4.8% | 4.3% |
| Hispanic | 7.1% | 13.6% | 19.3% |
Gender in Lansing
See the full breakdown
Lansing is 46.9% female with 5,273 female residents.
Lansing is 53.1% male with 5,973 male residents.
| Gender | Lansing | KS | USA |
|---|---|---|---|
| Female | 46.9% | 49.8% | 50.5% |
| Male | 53.1% | 50.2% | 49.5% |
Highest level of educational attainment in Lansing for adults over 25
See the full breakdown
2.0% of adults in Lansing completed < 9th grade.
2.0% of adults in Lansing completed 9-12th grade.
33.0% of adults in Lansing completed high school / ged.
23.0% of adults in Lansing completed some college.
4.0% of adults in Lansing completed associate's degree.
19.0% of adults in Lansing completed bachelor's degree.
15.0% of adults in Lansing completed master's degree.
1.0% of adults in Lansing completed professional degree.
1.0% of adults in Lansing completed doctorate degree.
| Education | Lansing | KS | USA |
|---|---|---|---|
| < 9th Grade | 2.0% | 4.0% | 4.0% |
| 9-12th Grade | 2.0% | 5.0% | 6.0% |
| High School / GED | 33.0% | 25.0% | 26.0% |
| Some College | 23.0% | 22.0% | 19.0% |
| Associate's Degree | 4.0% | 9.0% | 9.0% |
| Bachelor's Degree | 19.0% | 22.0% | 22.0% |
| Master's Degree | 15.0% | 10.0% | 10.0% |
| Professional Degree | 1.0% | 2.0% | 2.0% |
| Doctorate Degree | 1.0% | 1.0% | 2.0% |
Household Income For Lansing, Kansas
See the full breakdown
4.6% of households in Lansing earn Less than $10,000.
1.5% of households in Lansing earn $10,000 to $14,999.
2.6% of households in Lansing earn $15,000 to $24,999.
3.0% of households in Lansing earn $25,000 to $34,999.
10.5% of households in Lansing earn $35,000 to $49,999.
14.8% of households in Lansing earn $50,000 to $74,999.
10.9% of households in Lansing earn $75,000 to $99,999.
25.5% of households in Lansing earn $100,000 to $149,999.
13.2% of households in Lansing earn $150,000 to $199,999.
13.3% of households in Lansing earn $200,000 or more.
| Income | Lansing | KS | USA |
|---|---|---|---|
| Less than $10,000 | 4.6% | 4.4% | 5.0% |
| $10,000 to $14,999 | 1.5% | 3.2% | 3.4% |
| $15,000 to $24,999 | 2.6% | 6.2% | 6.3% |
| $25,000 to $34,999 | 3.0% | 7.9% | 6.6% |
| $35,000 to $49,999 | 10.5% | 11.1% | 10.1% |
| $50,000 to $74,999 | 14.8% | 17.7% | 15.5% |
| $75,000 to $99,999 | 10.9% | 13.5% | 12.6% |
| $100,000 to $149,999 | 25.5% | 17.7% | 17.5% |
| $150,000 to $199,999 | 13.2% | 8.8% | 9.6% |
| $200,000 or more | 13.3% | 9.6% | 13.4% |
Source: U.S. Census ACS 5-year estimates (2024)


