Paola SnackAbility
Overall SnackAbility
Crime in Paola summary. We use data from the FBI to determine the crime rates in Paola. Key points include:
There were 80 total crimes in Paola in the last reporting year.
The overall crime rate per 100,000 people in Paola is 1,382.2 / 100k people.
The violent crime rate per 100,000 people in Paola is 172.8 / 100k people.
The property crime rate per 100,000 people in Paola is 1,209.4 / 100k people.
Overall, crime in Paola is -34.78% below the national average.
Total Crimes
Below National Average
Crime In Paola Comparison Table
| Statistic | Count Raw |
Paola / 100k People |
Kansas / 100k People |
National / 100k People |
|---|---|---|---|---|
| Total Crimes Per 100K | 80 | 1,382.2 | 2,395.1 | 2,119.2 |
| Violent Crime | 10 | 172.8 | 438.7 | 359.0 |
| Murder | 0 | 0.0 | 3.8 | 5.0 |
| Robbery | 1 | 17.3 | 30.9 | 61.0 |
| Aggravated Assault | 8 | 138.2 | 359.9 | 256.0 |
| Property Crime | 70 | 1,209.4 | 1,956.4 | 1,760.0 |
| Burglary | 9 | 155.5 | 261.6 | 229.0 |
| Larceny | 60 | 1,036.6 | 1,458.5 | 1,272.0 |
| Car Theft | 1 | 17.3 | 236.3 | 259.0 |
Source: FBI Uniform Crime Reporting (2024)
Cost of living in Paola summary. We use data on the cost of living to determine how expensive it is to live in Paola. Real estate prices drive most of the variance in cost of living around Kansas. Key points include:
The cost of living in Paola is 94 with 100 being average.
The cost of living in Paola is 0.9x lower than the national average.
The median home value in Paola is $371,665.
The median income in Paola is $74,662.
Paola's Overall Cost Of Living
Lower Than The National Average
Cost Of Living In Paola Comparison Table
| Living Expense | Paola | Kansas | National Average |
|---|---|---|---|
| Overall | 94 | 91 | 100 |
| Services | 100 | 98 | 100 |
| Groceries | 93 | 97 | 100 |
| Health | 87 | 76 | 100 |
| Housing | 94 | 97 | 100 |
| Transportation | 101 | 93 | 100 |
| Utilities | 93 | 95 | 100 |
Source: Cost of living index, normalized to US average = 100
Paola, KS Weather
The average high in Paola is 65.9° and the average low is 44.6°.
There are 61.5 days of precipitation each year.
Expect an average of 41.2 inches of precipitation each year with 10.8 inches of snow.
| Stat | Paola |
|---|---|
| Average Annual High | 65.9 |
| Average Annual Low | 44.6 |
| Annual Precipitation Days | 61.5 |
| Average Annual Precipitation | 41.2 |
| Average Annual Snowfall | 10.8 |
Average High
Days of Rain
Source: NOAA climate normals (30-year)
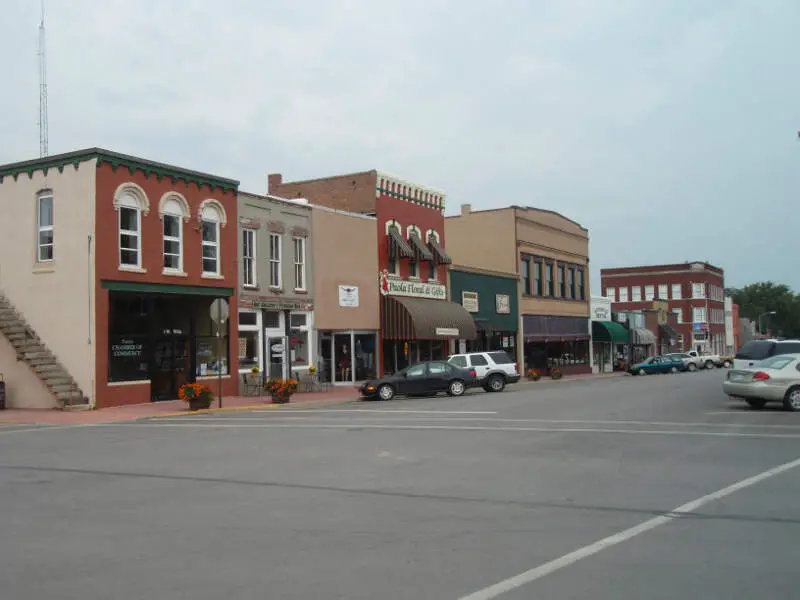
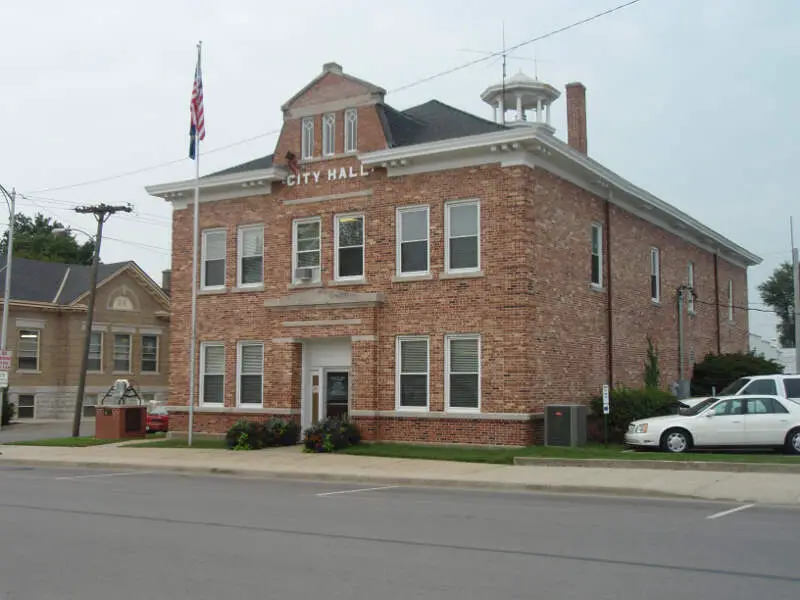
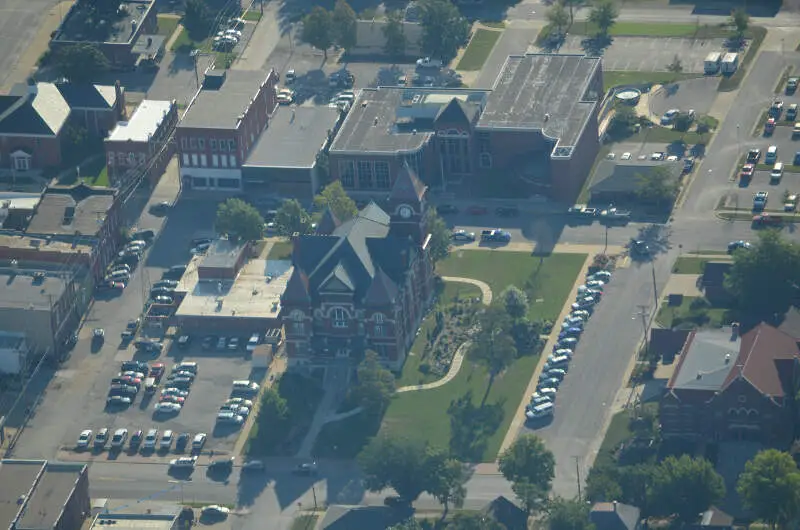
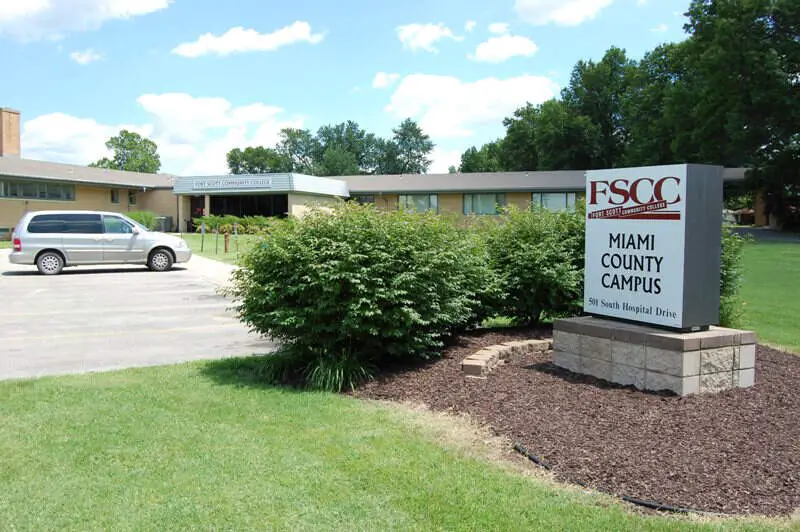
Paola, KS Photos

Rankings & Articles For Paola


Locations Around Paola
Map Of Paola, KS
Best Places Around Paola
Lee's Summit, MO
Population 103,656
Parkville, MO
Population 8,366
Leawood, KS
Population 33,809
Mission Hills, KS
Population 3,548
Fairway, KS
Population 4,159
Raymore, MO
Population 24,526
Olathe, KS
Population 145,057
Lenexa, KS
Population 58,384
Eudora, KS
Population 6,119
Greenwood, MO
Population 6,013
Paola Demographics And Statistics
Population over time in Paola
The current population in Paola is 5,770. The population has increased 4.5% from 2010.
| Year | Population | % Change |
|---|---|---|
| 2024 | 5,770 | 0.2% |
| 2023 | 5,757 | 0.3% |
| 2022 | 5,742 | 0.2% |
| 2021 | 5,733 | 1.8% |
| 2020 | 5,634 | 0.4% |
| 2019 | 5,611 | 0.5% |
| 2018 | 5,585 | 0.0% |
| 2017 | 5,583 | 0.0% |
| 2016 | 5,583 | 0.2% |
| 2015 | 5,570 | -0.3% |
| 2014 | 5,589 | 0.3% |
| 2013 | 5,575 | 0.2% |
| 2012 | 5,565 | 0.1% |
| 2011 | 5,560 | 0.7% |
| 2010 | 5,523 | - |
Race / Ethnicity in Paola
See the full breakdown
Paola is:
94.1% White with 5,427 White residents.
1.6% African American with 95 African American residents.
0.3% American Indian with 16 American Indian residents.
0.4% Asian with 21 Asian residents.
0.0% Hawaiian with 0 Hawaiian residents.
0.0% Other with 0 Other residents.
2.7% Two Or More with 154 Two Or More residents.
1.0% Hispanic with 57 Hispanic residents.
| Race | Paola | KS | USA |
|---|---|---|---|
| White | 94.1% | 72.7% | 57.4% |
| African American | 1.6% | 5.2% | 11.9% |
| American Indian | 0.3% | 0.4% | 0.5% |
| Asian | 0.4% | 2.9% | 5.9% |
| Hawaiian | 0.0% | 0.1% | 0.2% |
| Other | 0.0% | 0.4% | 0.6% |
| Two Or More | 2.7% | 4.8% | 4.3% |
| Hispanic | 1.0% | 13.6% | 19.3% |
Gender in Paola
See the full breakdown
Paola is 51.9% female with 2,993 female residents.
Paola is 48.1% male with 2,777 male residents.
| Gender | Paola | KS | USA |
|---|---|---|---|
| Female | 51.9% | 49.8% | 50.5% |
| Male | 48.1% | 50.2% | 49.5% |
Highest level of educational attainment in Paola for adults over 25
See the full breakdown
4.0% of adults in Paola completed < 9th grade.
8.0% of adults in Paola completed 9-12th grade.
30.0% of adults in Paola completed high school / ged.
25.0% of adults in Paola completed some college.
7.0% of adults in Paola completed associate's degree.
16.0% of adults in Paola completed bachelor's degree.
7.0% of adults in Paola completed master's degree.
2.0% of adults in Paola completed professional degree.
1.0% of adults in Paola completed doctorate degree.
| Education | Paola | KS | USA |
|---|---|---|---|
| < 9th Grade | 4.0% | 4.0% | 4.0% |
| 9-12th Grade | 8.0% | 5.0% | 6.0% |
| High School / GED | 30.0% | 25.0% | 26.0% |
| Some College | 25.0% | 22.0% | 19.0% |
| Associate's Degree | 7.0% | 9.0% | 9.0% |
| Bachelor's Degree | 16.0% | 22.0% | 22.0% |
| Master's Degree | 7.0% | 10.0% | 10.0% |
| Professional Degree | 2.0% | 2.0% | 2.0% |
| Doctorate Degree | 1.0% | 1.0% | 2.0% |
Household Income For Paola, Kansas
See the full breakdown
7.1% of households in Paola earn Less than $10,000.
1.6% of households in Paola earn $10,000 to $14,999.
7.2% of households in Paola earn $15,000 to $24,999.
8.4% of households in Paola earn $25,000 to $34,999.
11.5% of households in Paola earn $35,000 to $49,999.
14.8% of households in Paola earn $50,000 to $74,999.
14.7% of households in Paola earn $75,000 to $99,999.
16.2% of households in Paola earn $100,000 to $149,999.
6.8% of households in Paola earn $150,000 to $199,999.
11.6% of households in Paola earn $200,000 or more.
| Income | Paola | KS | USA |
|---|---|---|---|
| Less than $10,000 | 7.1% | 4.4% | 5.0% |
| $10,000 to $14,999 | 1.6% | 3.2% | 3.4% |
| $15,000 to $24,999 | 7.2% | 6.2% | 6.3% |
| $25,000 to $34,999 | 8.4% | 7.9% | 6.6% |
| $35,000 to $49,999 | 11.5% | 11.1% | 10.1% |
| $50,000 to $74,999 | 14.8% | 17.7% | 15.5% |
| $75,000 to $99,999 | 14.7% | 13.5% | 12.6% |
| $100,000 to $149,999 | 16.2% | 17.7% | 17.5% |
| $150,000 to $199,999 | 6.8% | 8.8% | 9.6% |
| $200,000 or more | 11.6% | 9.6% | 13.4% |
Source: U.S. Census ACS 5-year estimates (2024)


