Bowling Green SnackAbility
Overall SnackAbility
Crime in Bowling Green summary. We use data from the FBI to determine the crime rates in Bowling Green. Key points include:
There were 2,444 total crimes in Bowling Green in the last reporting year.
The overall crime rate per 100,000 people in Bowling Green is 3,153.4 / 100k people.
The violent crime rate per 100,000 people in Bowling Green is 224.5 / 100k people.
The property crime rate per 100,000 people in Bowling Green is 2,928.9 / 100k people.
Overall, crime in Bowling Green is 48.80% above the national average.
Total Crimes
Above National Average
Crime In Bowling Green Comparison Table
| Statistic | Count Raw |
Bowling Green / 100k People |
Kentucky / 100k People |
National / 100k People |
|---|---|---|---|---|
| Total Crimes Per 100K | 2,444 | 3,153.4 | 1,563.0 | 2,119.2 |
| Violent Crime | 174 | 224.5 | 213.1 | 359.0 |
| Murder | 1 | 1.3 | 6.1 | 5.0 |
| Robbery | 36 | 46.4 | 35.1 | 61.0 |
| Aggravated Assault | 68 | 87.7 | 139.5 | 256.0 |
| Property Crime | 2,270 | 2,928.9 | 1,349.9 | 1,760.0 |
| Burglary | 264 | 340.6 | 193.6 | 229.0 |
| Larceny | 1,800 | 2,322.5 | 930.2 | 1,272.0 |
| Car Theft | 206 | 265.8 | 226.2 | 259.0 |
Source: FBI Uniform Crime Reporting (2024)
Cost of living in Bowling Green summary. We use data on the cost of living to determine how expensive it is to live in Bowling Green. Real estate prices drive most of the variance in cost of living around Kentucky. Key points include:
The cost of living in Bowling Green is 95 with 100 being average.
The cost of living in Bowling Green is 0.9x lower than the national average.
The median home value in Bowling Green is $288,241.
The median income in Bowling Green is $48,873.
Bowling Green's Overall Cost Of Living
Lower Than The National Average
Cost Of Living In Bowling Green Comparison Table
| Living Expense | Bowling Green | Kentucky | National Average |
|---|---|---|---|
| Overall | 95 | 89 | 100 |
| Services | 96 | 100 | 100 |
| Groceries | 99 | 98 | 100 |
| Health | 91 | 68 | 100 |
| Housing | 91 | 98 | 100 |
| Transportation | 93 | 95 | 100 |
| Utilities | 91 | 96 | 100 |
Source: Cost of living index, normalized to US average = 100
Bowling Green, KY Weather
The average high in Bowling Green is 68.2° and the average low is 45.7°.
There are 79.7 days of precipitation each year.
Expect an average of 50.3 inches of precipitation each year with 6.5 inches of snow.
| Stat | Bowling Green |
|---|---|
| Average Annual High | 68.2 |
| Average Annual Low | 45.7 |
| Annual Precipitation Days | 79.7 |
| Average Annual Precipitation | 50.3 |
| Average Annual Snowfall | 6.5 |
Average High
Days of Rain
Source: NOAA climate normals (30-year)
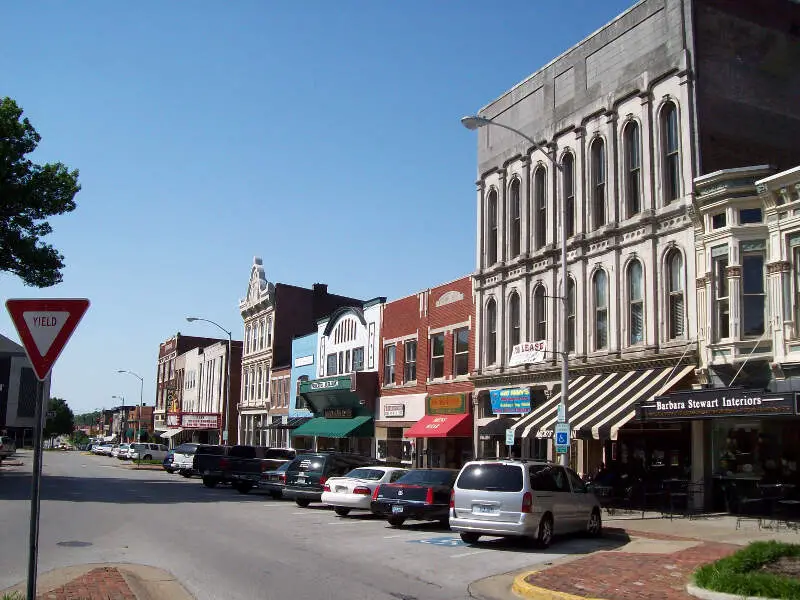
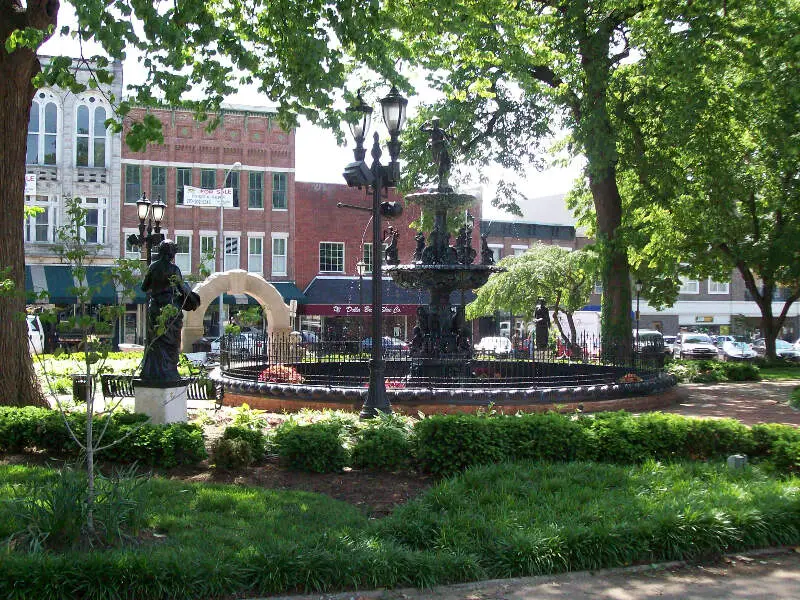
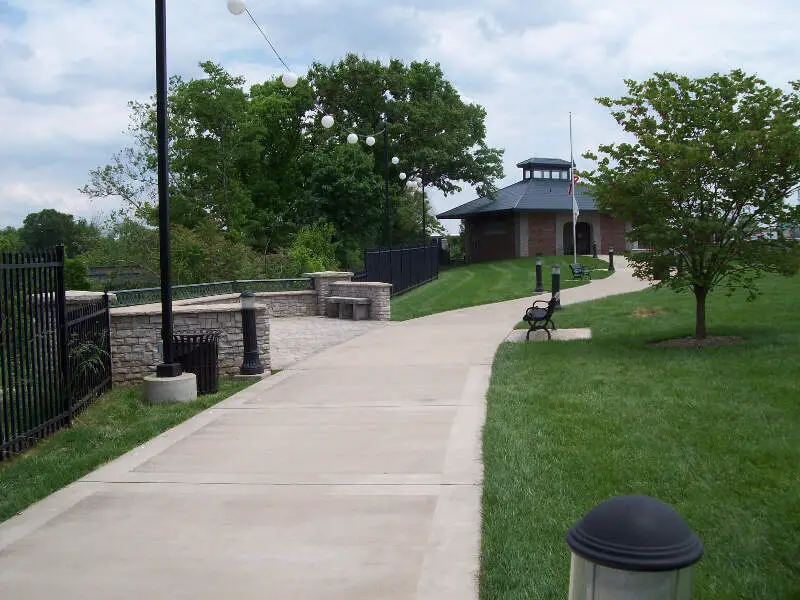
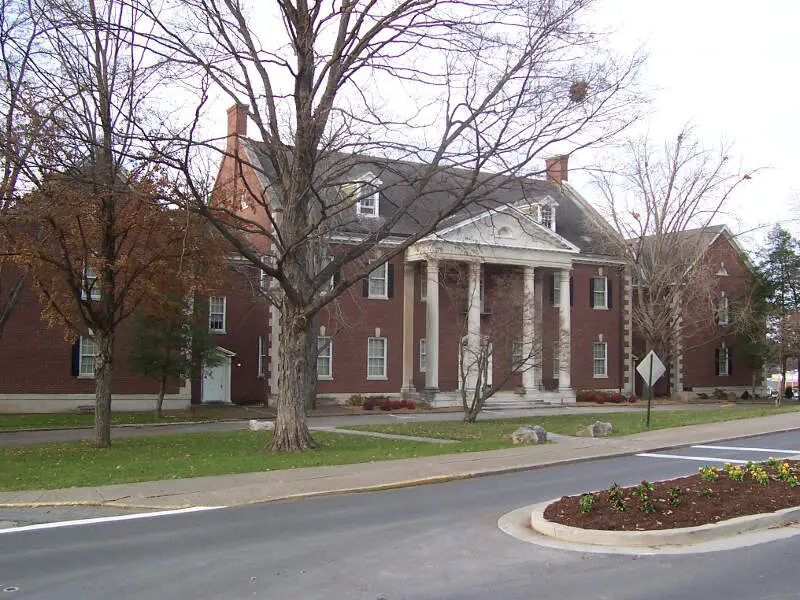
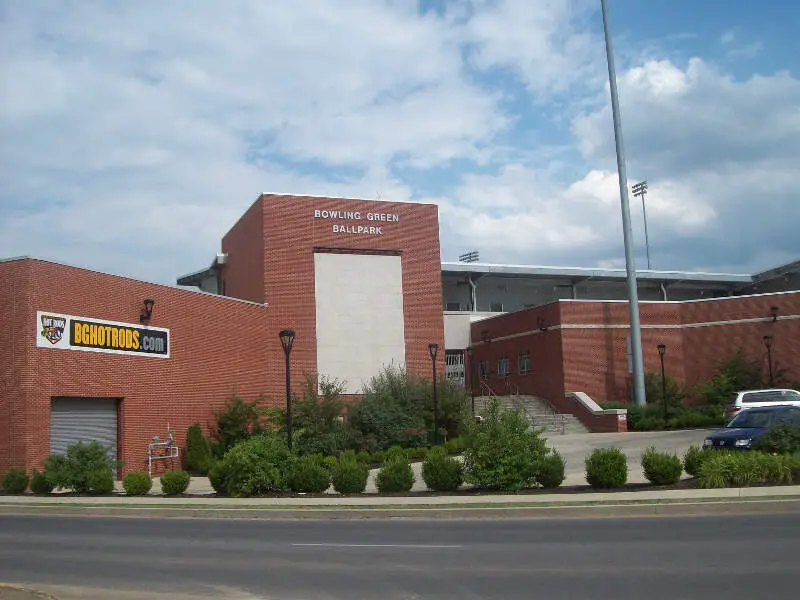
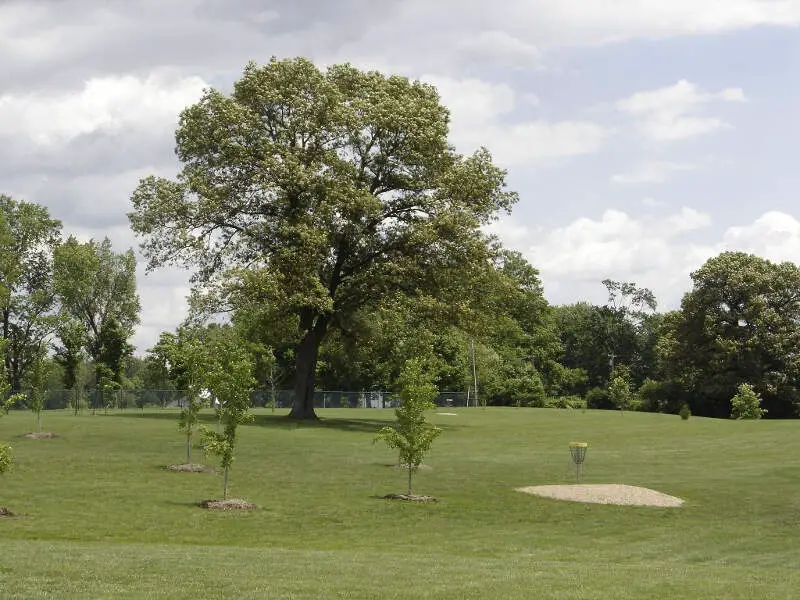
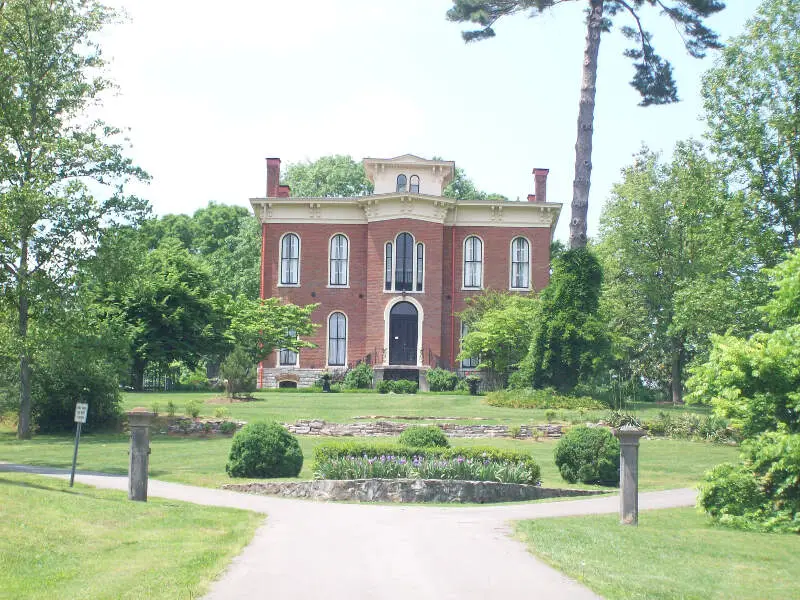
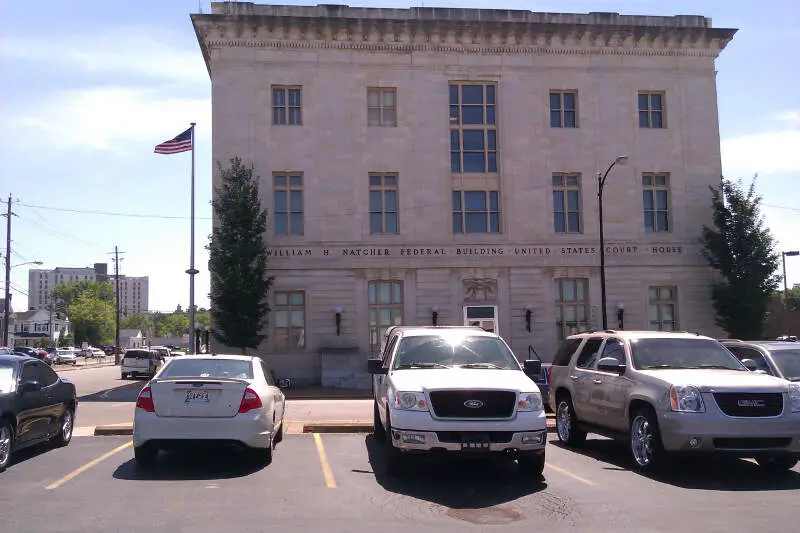
Bowling Green, KY Photos

Rankings & Articles For Bowling Green


Locations Around Bowling Green
Map Of Bowling Green, KY
Best Places Around Bowling Green
Hendersonville, TN
Population 63,091
White House, TN
Population 14,631
Millersville, TN
Population 5,836
Gallatin, TN
Population 48,532
Greenbrier, TN
Population 6,971
Portland, TN
Population 13,449
Goodlettsville, TN
Population 17,597
Central, LA
Population 29,783
Bowling Green Demographics And Statistics
Population over time in Bowling Green
The current population in Bowling Green is 75,388. The population has increased 33.7% from 2010.
| Year | Population | % Change |
|---|---|---|
| 2024 | 75,388 | 2.4% |
| 2023 | 73,638 | 1.7% |
| 2022 | 72,385 | 1.3% |
| 2021 | 71,422 | -0.3% |
| 2020 | 71,628 | 6.0% |
| 2019 | 67,600 | 2.8% |
| 2018 | 65,731 | 2.2% |
| 2017 | 64,302 | 2.4% |
| 2016 | 62,824 | 2.0% |
| 2015 | 61,617 | 1.6% |
| 2014 | 60,660 | 1.7% |
| 2013 | 59,618 | 1.7% |
| 2012 | 58,632 | 2.3% |
| 2011 | 57,323 | 1.6% |
| 2010 | 56,407 | - |
Race / Ethnicity in Bowling Green
See the full breakdown
Bowling Green is:
62.1% White with 46,827 White residents.
14.1% African American with 10,599 African American residents.
0.1% American Indian with 52 American Indian residents.
7.7% Asian with 5,802 Asian residents.
1.1% Hawaiian with 827 Hawaiian residents.
0.1% Other with 86 Other residents.
4.3% Two Or More with 3,239 Two Or More residents.
10.6% Hispanic with 7,956 Hispanic residents.
| Race | Bowling Green | KY | USA |
|---|---|---|---|
| White | 62.1% | 81.5% | 57.4% |
| African American | 14.1% | 7.6% | 11.9% |
| American Indian | 0.1% | 0.1% | 0.5% |
| Asian | 7.7% | 1.6% | 5.9% |
| Hawaiian | 1.1% | 0.1% | 0.2% |
| Other | 0.1% | 0.3% | 0.6% |
| Two Or More | 4.3% | 3.9% | 4.3% |
| Hispanic | 10.6% | 5.0% | 19.3% |
Gender in Bowling Green
See the full breakdown
Bowling Green is 49.7% female with 37,486 female residents.
Bowling Green is 50.3% male with 37,902 male residents.
| Gender | Bowling Green | KY | USA |
|---|---|---|---|
| Female | 49.7% | 50.5% | 50.5% |
| Male | 50.3% | 49.5% | 49.5% |
Highest level of educational attainment in Bowling Green for adults over 25
See the full breakdown
9.0% of adults in Bowling Green completed < 9th grade.
6.0% of adults in Bowling Green completed 9-12th grade.
26.0% of adults in Bowling Green completed high school / ged.
21.0% of adults in Bowling Green completed some college.
7.0% of adults in Bowling Green completed associate's degree.
18.0% of adults in Bowling Green completed bachelor's degree.
8.0% of adults in Bowling Green completed master's degree.
3.0% of adults in Bowling Green completed professional degree.
2.0% of adults in Bowling Green completed doctorate degree.
| Education | Bowling Green | KY | USA |
|---|---|---|---|
| < 9th Grade | 9.0% | 4.0% | 4.0% |
| 9-12th Grade | 6.0% | 7.0% | 6.0% |
| High School / GED | 26.0% | 33.0% | 26.0% |
| Some College | 21.0% | 20.0% | 19.0% |
| Associate's Degree | 7.0% | 9.0% | 9.0% |
| Bachelor's Degree | 18.0% | 16.0% | 22.0% |
| Master's Degree | 8.0% | 8.0% | 10.0% |
| Professional Degree | 3.0% | 2.0% | 2.0% |
| Doctorate Degree | 2.0% | 1.0% | 2.0% |
Household Income For Bowling Green, Kentucky
See the full breakdown
10.1% of households in Bowling Green earn Less than $10,000.
5.3% of households in Bowling Green earn $10,000 to $14,999.
10.6% of households in Bowling Green earn $15,000 to $24,999.
9.2% of households in Bowling Green earn $25,000 to $34,999.
16.3% of households in Bowling Green earn $35,000 to $49,999.
14.7% of households in Bowling Green earn $50,000 to $74,999.
11.5% of households in Bowling Green earn $75,000 to $99,999.
12.8% of households in Bowling Green earn $100,000 to $149,999.
4.6% of households in Bowling Green earn $150,000 to $199,999.
5.0% of households in Bowling Green earn $200,000 or more.
| Income | Bowling Green | KY | USA |
|---|---|---|---|
| Less than $10,000 | 10.1% | 6.1% | 5.0% |
| $10,000 to $14,999 | 5.3% | 5.2% | 3.4% |
| $15,000 to $24,999 | 10.6% | 8.3% | 6.3% |
| $25,000 to $34,999 | 9.2% | 8.3% | 6.6% |
| $35,000 to $49,999 | 16.3% | 12.1% | 10.1% |
| $50,000 to $74,999 | 14.7% | 17.1% | 15.5% |
| $75,000 to $99,999 | 11.5% | 12.8% | 12.6% |
| $100,000 to $149,999 | 12.8% | 15.9% | 17.5% |
| $150,000 to $199,999 | 4.6% | 7.1% | 9.6% |
| $200,000 or more | 5.0% | 7.2% | 13.4% |
Source: U.S. Census ACS 5-year estimates (2024)


