Hammond SnackAbility
Overall SnackAbility
Crime in Hammond summary. We use data from the FBI to determine the crime rates in Hammond. Key points include:
There were 1,629 total crimes in Hammond in the last reporting year.
The overall crime rate per 100,000 people in Hammond is 7,814.1 / 100k people.
The violent crime rate per 100,000 people in Hammond is 1,228.0 / 100k people.
The property crime rate per 100,000 people in Hammond is 6,586.1 / 100k people.
Overall, crime in Hammond is 268.72% above the national average.
Total Crimes
Above National Average
Crime In Hammond Comparison Table
| Statistic | Count Raw |
Hammond / 100k People |
Louisiana / 100k People |
National / 100k People |
|---|---|---|---|---|
| Total Crimes Per 100K | 1,629 | 7,814.1 | 2,816.2 | 2,119.2 |
| Violent Crime | 256 | 1,228.0 | 519.8 | 359.0 |
| Murder | 0 | 0.0 | 10.8 | 5.0 |
| Robbery | 18 | 86.3 | 39.4 | 61.0 |
| Aggravated Assault | 225 | 1,079.3 | 436.0 | 256.0 |
| Property Crime | 1,373 | 6,586.1 | 2,296.4 | 1,760.0 |
| Burglary | 156 | 748.3 | 405.4 | 229.0 |
| Larceny | 1,150 | 5,516.4 | 1,636.2 | 1,272.0 |
| Car Theft | 67 | 321.4 | 254.8 | 259.0 |
Source: FBI Uniform Crime Reporting (2024)
Cost of living in Hammond summary. We use data on the cost of living to determine how expensive it is to live in Hammond. Real estate prices drive most of the variance in cost of living around Louisiana. Key points include:
The cost of living in Hammond is 96 with 100 being average.
The cost of living in Hammond is 1.0x lower than the national average.
The median home value in Hammond is $222,618.
The median income in Hammond is $48,166.
Hammond's Overall Cost Of Living
Lower Than The National Average
Cost Of Living In Hammond Comparison Table
| Living Expense | Hammond | Louisiana | National Average |
|---|---|---|---|
| Overall | 96 | 91 | 100 |
| Services | 94 | 97 | 100 |
| Groceries | 96 | 97 | 100 |
| Health | 92 | 82 | 100 |
| Housing | 95 | 97 | 100 |
| Transportation | 101 | 99 | 100 |
| Utilities | 92 | 96 | 100 |
Source: Cost of living index, normalized to US average = 100
Hammond, LA Weather
The average high in Hammond is 78.4° and the average low is 55.7°.
There are 76.7 days of precipitation each year.
Expect an average of 62.6 inches of precipitation each year with 0.0 inches of snow.
| Stat | Hammond |
|---|---|
| Average Annual High | 78.4 |
| Average Annual Low | 55.7 |
| Annual Precipitation Days | 76.7 |
| Average Annual Precipitation | 62.6 |
| Average Annual Snowfall | 0.0 |
Average High
Days of Rain
Source: NOAA climate normals (30-year)
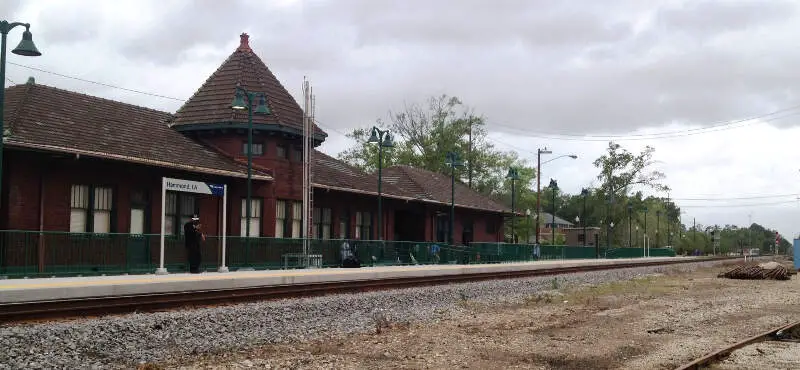
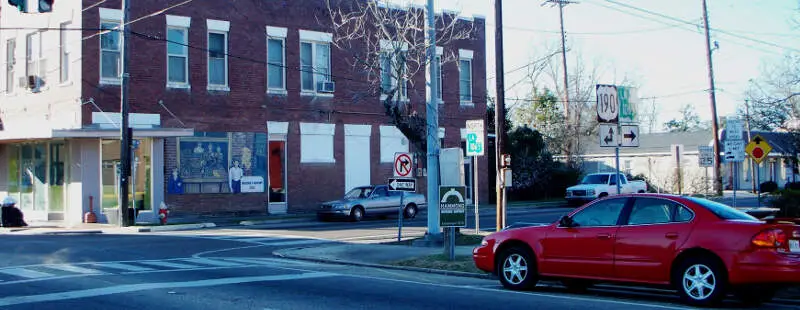
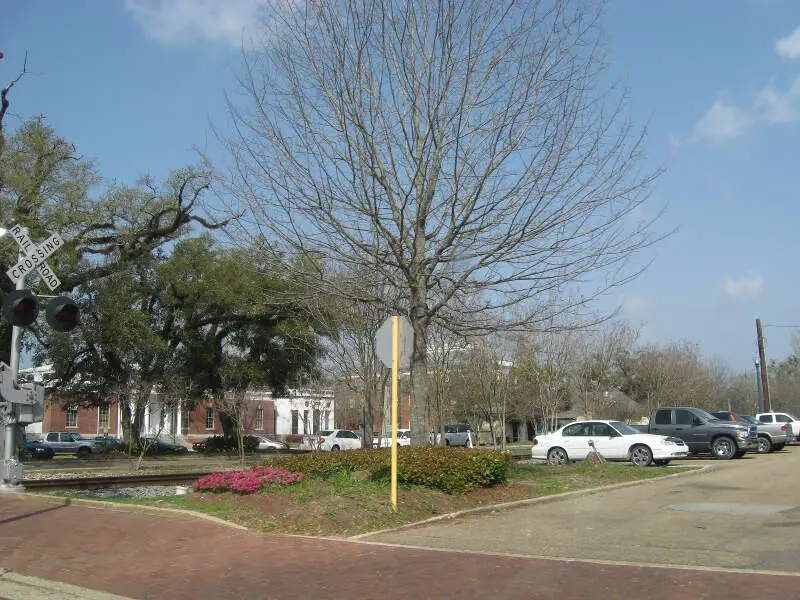
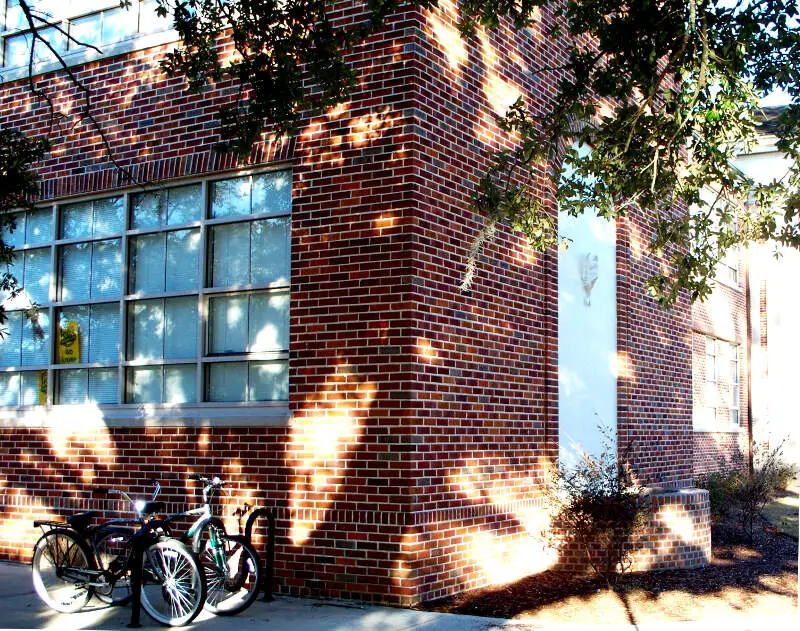
Hammond, LA Photos
4 Reviews & Comments About Hammond

I lived in hammond for like 6 years and loved it
I've lived in Hammond most of my life. I was a teacher there for several years and my children went school in Hammond for all of their education. I found the schools to be very good. I've lived in the same house for twenty years and have never had been robbed or had any other crime committed on me or my property. I don't live in a ritzy neighborhood that's gated. I live right by the interstate in a 58,000.00 house when I bought it 20 years ago. It's a wonderful place to live and raise children!!
There are great restaurants and SLU is here and they put on all kind of events and entertainment. We also have Columbia Theater which puts on plays. Also we have a great movie theater, skate park, safari quest, laser tag, children's museum, open air mall, many parks, and recreation. We're 50 min. from Baton Rouge and a hour from New Orleans.
Even though Hammond isn't as small a town as when we moved up here from River Ridge in 87, I think it's still a great town that still had a bit of the small town feel to it. The people for the most part are courteous to each other and do try to look out for each other.
Good- still has a small town vibe. Bad- traffic can be heavy at times. I don't think the roads can match the increased traffic.
I live in Hammond apartment and I love da Hammond toula natalbany tickfaw etc area I love how ponchatoula has a good strawberry festival and has a gator in middle of town no udda city I heard of besides toula has live animal in middle of town
Rankings & Articles For Hammond


Locations Around Hammond
Map Of Hammond, LA
Best Places Around Hammond
New Orleans, LA
Population 371,853
Harvey, LA
Population 20,915
Westwego, LA
Population 8,335
Baton Rouge, LA
Population 222,771
Bogalusa, LA
Population 10,468
Kenner, LA
Population 64,904
Chalmette, LA
Population 22,616
Marrero, LA
Population 32,540
Metairie, LA
Population 139,729
Baker, LA
Population 12,253
Hammond Demographics And Statistics
Population over time in Hammond
The current population in Hammond is 21,539. The population has increased 9.1% from 2010.
| Year | Population | % Change |
|---|---|---|
| 2024 | 21,539 | 3.6% |
| 2023 | 20,790 | 2.7% |
| 2022 | 20,239 | 4.5% |
| 2021 | 19,374 | -5.8% |
| 2020 | 20,557 | -0.5% |
| 2019 | 20,668 | 1.1% |
| 2018 | 20,444 | 0.6% |
| 2017 | 20,325 | -0.3% |
| 2016 | 20,389 | 0.6% |
| 2015 | 20,272 | 0.3% |
| 2014 | 20,207 | 0.5% |
| 2013 | 20,107 | 0.6% |
| 2012 | 19,986 | 0.3% |
| 2011 | 19,926 | 0.9% |
| 2010 | 19,740 | - |
Race / Ethnicity in Hammond
See the full breakdown
Hammond is:
49.9% White with 10,752 White residents.
43.4% African American with 9,340 African American residents.
0.0% American Indian with 0 American Indian residents.
1.2% Asian with 266 Asian residents.
0.0% Hawaiian with 0 Hawaiian residents.
0.9% Other with 198 Other residents.
1.6% Two Or More with 340 Two Or More residents.
3.0% Hispanic with 643 Hispanic residents.
| Race | Hammond | LA | USA |
|---|---|---|---|
| White | 49.9% | 55.7% | 57.4% |
| African American | 43.4% | 30.5% | 11.9% |
| American Indian | 0.0% | 0.4% | 0.5% |
| Asian | 1.2% | 1.7% | 5.9% |
| Hawaiian | 0.0% | 0.1% | 0.2% |
| Other | 0.9% | 0.5% | 0.6% |
| Two Or More | 1.6% | 3.8% | 4.3% |
| Hispanic | 3.0% | 7.2% | 19.3% |
Gender in Hammond
See the full breakdown
Hammond is 50.2% female with 10,817 female residents.
Hammond is 49.8% male with 10,722 male residents.
| Gender | Hammond | LA | USA |
|---|---|---|---|
| Female | 50.2% | 51.1% | 50.5% |
| Male | 49.8% | 48.9% | 49.5% |
Highest level of educational attainment in Hammond for adults over 25
See the full breakdown
5.0% of adults in Hammond completed < 9th grade.
8.0% of adults in Hammond completed 9-12th grade.
26.0% of adults in Hammond completed high school / ged.
21.0% of adults in Hammond completed some college.
12.0% of adults in Hammond completed associate's degree.
18.0% of adults in Hammond completed bachelor's degree.
6.0% of adults in Hammond completed master's degree.
1.0% of adults in Hammond completed professional degree.
3.0% of adults in Hammond completed doctorate degree.
| Education | Hammond | LA | USA |
|---|---|---|---|
| < 9th Grade | 5.0% | 6.0% | 4.0% |
| 9-12th Grade | 8.0% | 8.0% | 6.0% |
| High School / GED | 26.0% | 32.0% | 26.0% |
| Some College | 21.0% | 20.0% | 19.0% |
| Associate's Degree | 12.0% | 7.0% | 9.0% |
| Bachelor's Degree | 18.0% | 17.0% | 22.0% |
| Master's Degree | 6.0% | 7.0% | 10.0% |
| Professional Degree | 1.0% | 2.0% | 2.0% |
| Doctorate Degree | 3.0% | 1.0% | 2.0% |
Household Income For Hammond, Louisiana
See the full breakdown
8.9% of households in Hammond earn Less than $10,000.
10.0% of households in Hammond earn $10,000 to $14,999.
14.0% of households in Hammond earn $15,000 to $24,999.
6.0% of households in Hammond earn $25,000 to $34,999.
12.9% of households in Hammond earn $35,000 to $49,999.
17.7% of households in Hammond earn $50,000 to $74,999.
8.3% of households in Hammond earn $75,000 to $99,999.
9.4% of households in Hammond earn $100,000 to $149,999.
7.7% of households in Hammond earn $150,000 to $199,999.
5.1% of households in Hammond earn $200,000 or more.
| Income | Hammond | LA | USA |
|---|---|---|---|
| Less than $10,000 | 8.9% | 7.2% | 5.0% |
| $10,000 to $14,999 | 10.0% | 5.8% | 3.4% |
| $15,000 to $24,999 | 14.0% | 9.4% | 6.3% |
| $25,000 to $34,999 | 6.0% | 8.4% | 6.6% |
| $35,000 to $49,999 | 12.9% | 11.8% | 10.1% |
| $50,000 to $74,999 | 17.7% | 15.9% | 15.5% |
| $75,000 to $99,999 | 8.3% | 11.7% | 12.6% |
| $100,000 to $149,999 | 9.4% | 14.8% | 17.5% |
| $150,000 to $199,999 | 7.7% | 7.3% | 9.6% |
| $200,000 or more | 5.1% | 7.8% | 13.4% |
Source: U.S. Census ACS 5-year estimates (2024)


