Compare New Orleans to…
New Orleans SnackAbility
Overall SnackAbility
Crime in New Orleans summary. We use data from the FBI to determine the crime rates in New Orleans. Key points include:
There were 23,493 total crimes in New Orleans in the last reporting year.
The overall crime rate per 100,000 people in New Orleans is 6,450.6 / 100k people.
The violent crime rate per 100,000 people in New Orleans is 1,361.1 / 100k people.
The property crime rate per 100,000 people in New Orleans is 5,089.6 / 100k people.
Overall, crime in New Orleans is 204.39% above the national average.
Total Crimes
Above National Average
Crime In New Orleans Comparison Table
| Statistic | Count Raw |
New Orleans / 100k People |
Louisiana / 100k People |
National / 100k People |
|---|---|---|---|---|
| Total Crimes Per 100K | 23,493 | 6,450.6 | 2,816.2 | 2,119.2 |
| Violent Crime | 4,957 | 1,361.1 | 519.8 | 359.0 |
| Murder | 193 | 53.0 | 10.8 | 5.0 |
| Robbery | 656 | 180.1 | 39.4 | 61.0 |
| Aggravated Assault | 3,427 | 941.0 | 436.0 | 256.0 |
| Property Crime | 18,536 | 5,089.6 | 2,296.4 | 1,760.0 |
| Burglary | 1,742 | 478.3 | 405.4 | 229.0 |
| Larceny | 10,091 | 2,770.8 | 1,636.2 | 1,272.0 |
| Car Theft | 6,703 | 1,840.5 | 254.8 | 259.0 |
Source: FBI Uniform Crime Reporting (2024)
Cost of living in New Orleans summary. We use data on the cost of living to determine how expensive it is to live in New Orleans. Real estate prices drive most of the variance in cost of living around Louisiana. Key points include:
The cost of living in New Orleans is 108 with 100 being average.
The cost of living in New Orleans is 1.1x higher than the national average.
The median home value in New Orleans is $242,492.
The median income in New Orleans is $56,631.
New Orleans's Overall Cost Of Living
Higher Than The National Average
Cost Of Living In New Orleans Comparison Table
| Living Expense | New Orleans | Louisiana | National Average |
|---|---|---|---|
| Overall | 108 | 91 | 100 |
| Services | 100 | 97 | 100 |
| Groceries | 99 | 97 | 100 |
| Health | 128 | 82 | 100 |
| Housing | 94 | 97 | 100 |
| Transportation | 97 | 99 | 100 |
| Utilities | 96 | 96 | 100 |
Source: Cost of living index, normalized to US average = 100
New Orleans, LA Weather
The average high in New Orleans is 78.2° and the average low is 61.0°.
There are 75.6 days of precipitation each year.
Expect an average of 62.6 inches of precipitation each year with 0.0 inches of snow.
| Stat | New Orleans |
|---|---|
| Average Annual High | 78.2 |
| Average Annual Low | 61.0 |
| Annual Precipitation Days | 75.6 |
| Average Annual Precipitation | 62.6 |
| Average Annual Snowfall | 0.0 |
Average High
Days of Rain
Source: NOAA climate normals (30-year)
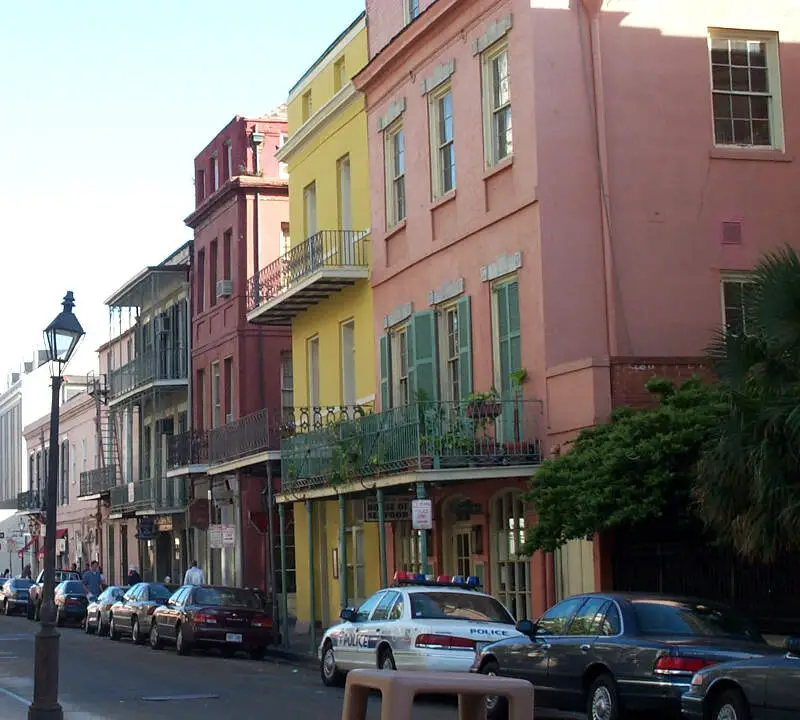
New Orleans, LA Photos


8 Reviews & Comments About New Orleans

I love New Orleans. It's a city rich in history, culture, great food and wonderful, warm, friendly people.
Be careful of crime in New Orleans, especially at night. However, the native people of New Orleans are some of the friendliest I've ever met.
Visit the French Quarter and then the St. Louis Cathedral. Visit the Bon Ton Cafe for dinner. I also recommend visiting the Natchez river boat and take a dinner cruise. Make sure to get a grenade in the french quarter. Also visit the famous cafe du Monde and get a beignet. If you are interested take in a s*x show or other nighttime activities in the old french quarter. A haunted walk or visit to an old cemetery is also recommended. The old french market is another fun place to see for gift and souvenirs.
The friendliness and the wonderful accents of all the people. The cajun food is awesome so please get some gumbo. Also enjoy the wonderful drinks. Take in the wonderful music that you'll find anywhere. This is America's coolest city.
Becoming difficult for locals to find affordable rentals.
Beautiful city, always something new to learn, like a secret lover.
It was my first time visiting. Very few parts of New Orleans are nice looking. The city is pretty run down; abandon buildings, a lot of homeless peoples, pan handlers..
The smell of Bourbon street is just awful. The whole street smells like a dumpster. If someone asked you for money and you didn't have it, or didn't give it, they were quick to use profanity towards you.
I did not have any run-ins with crime, but I made sure to stay in well populated areas. I had a wonderful time in New Orleans, and there was always something to do! The food was probably my favorite part of the trip. I also loved the down-home southern charm that many of the locals exuded.
My favorite place to visit in New Orleans was on Bourbon Street in the evening. The evening hours were not too cold or too hot, the temperature was perfectly comfortable. The city is immersed in a unique culture that in my opinion cannot be found anywhere else in the world!
New Orleans, Louisiana is like no other place on earth. It is a melting pot of different cultures, architectures, music, and cuisine. While it is not a very safe city and I wouldn't want to live there, I love to visit it frequently. The best time to go is in the fall or spring when the weather is not too hot and wet. I have traveled to many places around the world and i find that by far, New Orleans has the best food anywhere. Once one has eaten in this city, one will be forever spoiled to the flavorful spices used. All other food will seem extremely bland in comparison.
There are lots of fun things to do in New Orleans besides just eat, although I would be perfectly happy to just do that there! I love to meander through the French Quarter while having a few drinks. This is one of the few places in America where one can drink and stroll! Pat O'Brian's bar is famous for their Hurricanes which are very good as well as most of their other drinks. While walking in the French Quarter, it's fun to people-watch. I've never been to New Orleans during Mardi Gras as it is crazy enough during a regular weekend!
Going to Jackson Square on a Sunday morning is a real treat. I love to go to Cafe du Monde to eat the infamous french donut - the beignet. These are replicated in other places, but no one makes them like Cafe du Monde!
I always enjoy walking through the park at Jackson Square where you can watch all the artists and musicians. There used to also be fortune tellers back in the day, but apparently these have been outlawed.
If you look hard enough in the city, you can find voodoo shops and vampires! But if not, the clothing shopping is great. There is a fabulous hat shop in the French Quarter called Fleur de Paris. They custom make hats for the Kentucky Derby, but also have hats for sale off the rack. Their hats are the best quality and they fit them to the purchaser's head.
My experience was wonderful! Southern hospitality stood out in this city! We partied on burbon street and drank the famous hand grenades. We attended several Mardi Gras parades even though it wasn't Mardi Gras season they still find any reason to have a parade.
The culture in New Orleans is unbeatable. The soul food made from recipes passed down generation to generation is like nothing you have ever tasted before. The historic buildings are beautiful sights. The night life is one giant party till the sun comes up.
New Orleans is divine for art, music, food, history, architecture and more.
Avoid the tourist areas and you'll be just fine.
Rankings & Articles For New Orleans


Locations Around New Orleans
Map Of New Orleans, LA
Best Places Around New Orleans
Harvey, LA
Population 20,915
Westwego, LA
Population 8,335
Kenner, LA
Population 64,904
Chalmette, LA
Population 22,616
Marrero, LA
Population 32,540
Metairie, LA
Population 139,729
Violet, LA
Population 4,122
Gretna, LA
Population 17,389
Meraux, LA
Population 7,918
Estelle, LA
Population 16,341
New Orleans Demographics And Statistics
Population over time in New Orleans
The current population in New Orleans is 371,853. The population has increased 25.9% from 2010.
| Year | Population | % Change |
|---|---|---|
| 2024 | 371,853 | -1.1% |
| 2023 | 376,035 | -1.1% |
| 2022 | 380,408 | -0.9% |
| 2021 | 383,974 | -1.9% |
| 2020 | 391,249 | 0.1% |
| 2019 | 390,845 | 0.3% |
| 2018 | 389,648 | 0.4% |
| 2017 | 388,182 | 1.4% |
| 2016 | 382,922 | 1.6% |
| 2015 | 376,738 | 2.2% |
| 2014 | 368,471 | 3.2% |
| 2013 | 357,013 | 4.6% |
| 2012 | 341,407 | 6.2% |
| 2011 | 321,409 | 8.8% |
| 2010 | 295,285 | - |
Race / Ethnicity in New Orleans
See the full breakdown
New Orleans is:
30.1% White with 111,770 White residents.
53.9% African American with 200,368 African American residents.
0.1% American Indian with 486 American Indian residents.
2.8% Asian with 10,356 Asian residents.
0.0% Hawaiian with 45 Hawaiian residents.
1.0% Other with 3,552 Other residents.
4.0% Two Or More with 14,851 Two Or More residents.
8.2% Hispanic with 30,425 Hispanic residents.
| Race | New Orleans | LA | USA |
|---|---|---|---|
| White | 30.1% | 55.7% | 57.4% |
| African American | 53.9% | 30.5% | 11.9% |
| American Indian | 0.1% | 0.4% | 0.5% |
| Asian | 2.8% | 1.7% | 5.9% |
| Hawaiian | 0.0% | 0.1% | 0.2% |
| Other | 1.0% | 0.5% | 0.6% |
| Two Or More | 4.0% | 3.8% | 4.3% |
| Hispanic | 8.2% | 7.2% | 19.3% |
Gender in New Orleans
See the full breakdown
New Orleans is 52.9% female with 196,861 female residents.
New Orleans is 47.1% male with 174,992 male residents.
| Gender | New Orleans | LA | USA |
|---|---|---|---|
| Female | 52.9% | 51.1% | 50.5% |
| Male | 47.1% | 48.9% | 49.5% |
Highest level of educational attainment in New Orleans for adults over 25
See the full breakdown
3.0% of adults in New Orleans completed < 9th grade.
6.0% of adults in New Orleans completed 9-12th grade.
21.0% of adults in New Orleans completed high school / ged.
21.0% of adults in New Orleans completed some college.
6.0% of adults in New Orleans completed associate's degree.
23.0% of adults in New Orleans completed bachelor's degree.
12.0% of adults in New Orleans completed master's degree.
5.0% of adults in New Orleans completed professional degree.
3.0% of adults in New Orleans completed doctorate degree.
| Education | New Orleans | LA | USA |
|---|---|---|---|
| < 9th Grade | 3.0% | 6.0% | 4.0% |
| 9-12th Grade | 6.0% | 8.0% | 6.0% |
| High School / GED | 21.0% | 32.0% | 26.0% |
| Some College | 21.0% | 20.0% | 19.0% |
| Associate's Degree | 6.0% | 7.0% | 9.0% |
| Bachelor's Degree | 23.0% | 17.0% | 22.0% |
| Master's Degree | 12.0% | 7.0% | 10.0% |
| Professional Degree | 5.0% | 2.0% | 2.0% |
| Doctorate Degree | 3.0% | 1.0% | 2.0% |
Household Income For New Orleans, Louisiana
See the full breakdown
9.6% of households in New Orleans earn Less than $10,000.
7.6% of households in New Orleans earn $10,000 to $14,999.
9.9% of households in New Orleans earn $15,000 to $24,999.
7.7% of households in New Orleans earn $25,000 to $34,999.
11.0% of households in New Orleans earn $35,000 to $49,999.
14.5% of households in New Orleans earn $50,000 to $74,999.
10.3% of households in New Orleans earn $75,000 to $99,999.
13.1% of households in New Orleans earn $100,000 to $149,999.
6.0% of households in New Orleans earn $150,000 to $199,999.
10.3% of households in New Orleans earn $200,000 or more.
| Income | New Orleans | LA | USA |
|---|---|---|---|
| Less than $10,000 | 9.6% | 7.2% | 5.0% |
| $10,000 to $14,999 | 7.6% | 5.8% | 3.4% |
| $15,000 to $24,999 | 9.9% | 9.4% | 6.3% |
| $25,000 to $34,999 | 7.7% | 8.4% | 6.6% |
| $35,000 to $49,999 | 11.0% | 11.8% | 10.1% |
| $50,000 to $74,999 | 14.5% | 15.9% | 15.5% |
| $75,000 to $99,999 | 10.3% | 11.7% | 12.6% |
| $100,000 to $149,999 | 13.1% | 14.8% | 17.5% |
| $150,000 to $199,999 | 6.0% | 7.3% | 9.6% |
| $200,000 or more | 10.3% | 7.8% | 13.4% |
Source: U.S. Census ACS 5-year estimates (2024)


