Natchitoches, LA
Demographics And Statistics
Living In Natchitoches, Louisiana Summary
Life in Natchitoches research summary. HomeSnacks has been using Saturday Night Science to research the quality of life in Natchitoches over the past nine years using Census, FBI, Zillow, and other primary data sources. Based on the most recently available data, we found the following about life in Natchitoches:
The population in Natchitoches is 17,682.
The median home value in Natchitoches is $185,361.
The median income in Natchitoches is $38,731.
The cost of living in Natchitoches is 92 which is 0.9x lower than the national average.
The median rent in Natchitoches is $777.
The unemployment rate in Natchitoches is 7.6%.
The poverty rate in Natchitoches is 34.8%.
The average high in Natchitoches is 77.0° and the average low is 54.4°.
Natchitoches SnackAbility
Overall SnackAbility
Natchitoches, LA Crime Report
Crime in Natchitoches summary. We use data from the FBI to determine the crime rates in Natchitoches. Key points include:
There were 894 total crimes in Natchitoches in the last reporting year.
The overall crime rate per 100,000 people in Natchitoches is 5,275.9 / 100k people.
The violent crime rate per 100,000 people in Natchitoches is 891.1 / 100k people.
The property crime rate per 100,000 people in Natchitoches is 4,384.8 / 100k people.
Overall, crime in Natchitoches is 148.95% above the national average.
Total Crimes
Above National Average
Crime In Natchitoches Comparison Table
| Statistic | Count Raw | Natchitoches / 100k People | Louisiana / 100k People | National / 100k People |
|---|---|---|---|---|
| Total Crimes Per 100K | 894 | 5,275.9 | 2,816.2 | 2,119.2 |
| Violent Crime | 151 | 891.1 | 519.8 | 359.0 |
| Murder | 5 | 29.5 | 10.8 | 5.0 |
| Robbery | 8 | 47.2 | 39.4 | 61.0 |
| Aggravated Assault | 126 | 743.6 | 436.0 | 256.0 |
| Property Crime | 743 | 4,384.8 | 2,296.4 | 1,760.0 |
| Burglary | 221 | 1,304.2 | 405.4 | 229.0 |
| Larceny | 477 | 2,815.0 | 1,636.2 | 1,272.0 |
| Car Theft | 45 | 265.6 | 254.8 | 259.0 |
Natchitoches, LA Cost Of Living
Cost of living in Natchitoches summary. We use data on the cost of living to determine how expensive it is to live in Natchitoches. Real estate prices drive most of the variance in cost of living around Louisiana. Key points include:
The cost of living in Natchitoches is 92 with 100 being average.
The cost of living in Natchitoches is 0.9x lower than the national average.
The median home value in Natchitoches is $185,361.
The median income in Natchitoches is $38,731.
Natchitoches's Overall Cost Of Living
Lower Than The National Average
Cost Of Living In Natchitoches Comparison Table
| Living Expense | Natchitoches | Louisiana | National Average | |
|---|---|---|---|---|
| Overall | 92 | 90 | 100 | |
| Services | 95 | 94 | 100 | |
| Groceries | 94 | 93 | 100 | |
| Health | 86 | 100 | 100 | |
| Housing | 85 | 80 | 100 | |
| Transportation | 98 | 94 | 100 | |
| Utilities | 99 | 83 | 100 | |
Natchitoches, LA Weather
The average high in Natchitoches is 77.0° and the average low is 54.4°.
There are 70.3 days of precipitation each year.
Expect an average of 55.7 inches of precipitation each year with 0.3 inches of snow.
| Stat | Natchitoches |
|---|---|
| Average Annual High | 77.0 |
| Average Annual Low | 54.4 |
| Annual Precipitation Days | 70.3 |
| Average Annual Precipitation | 55.7 |
| Average Annual Snowfall | 0.3 |
Average High
Days of Rain
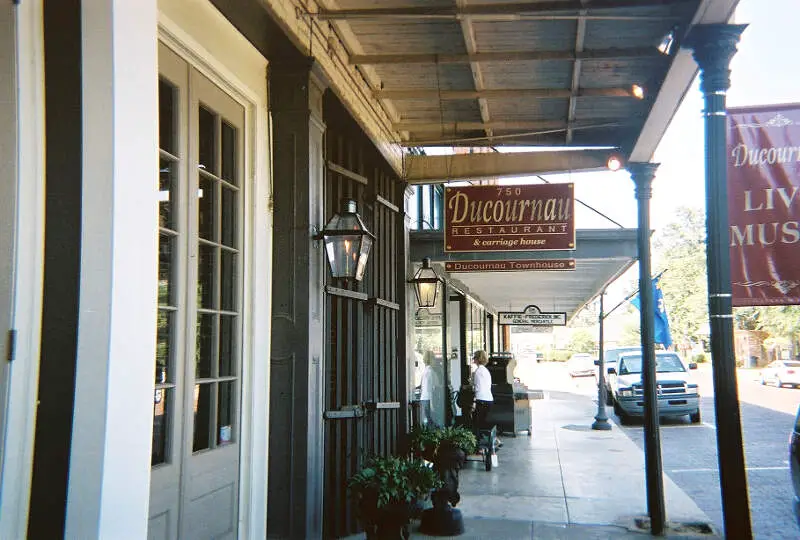
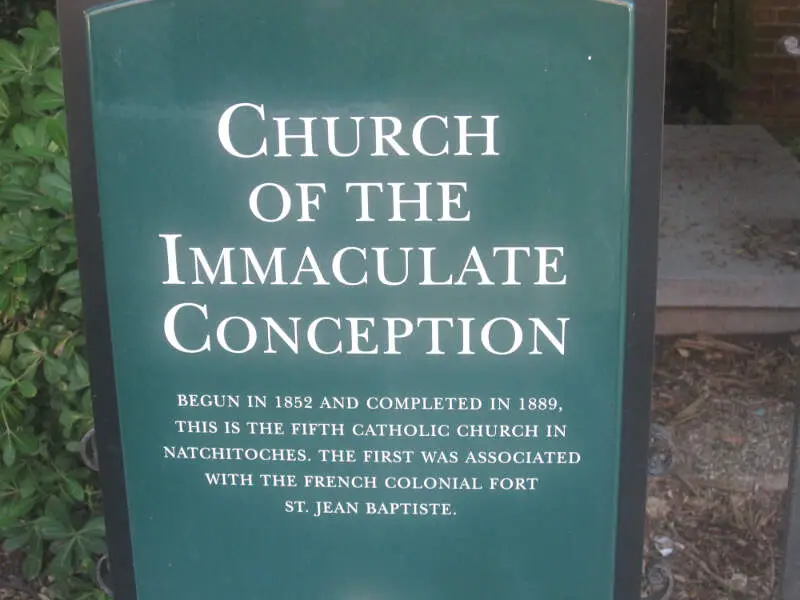
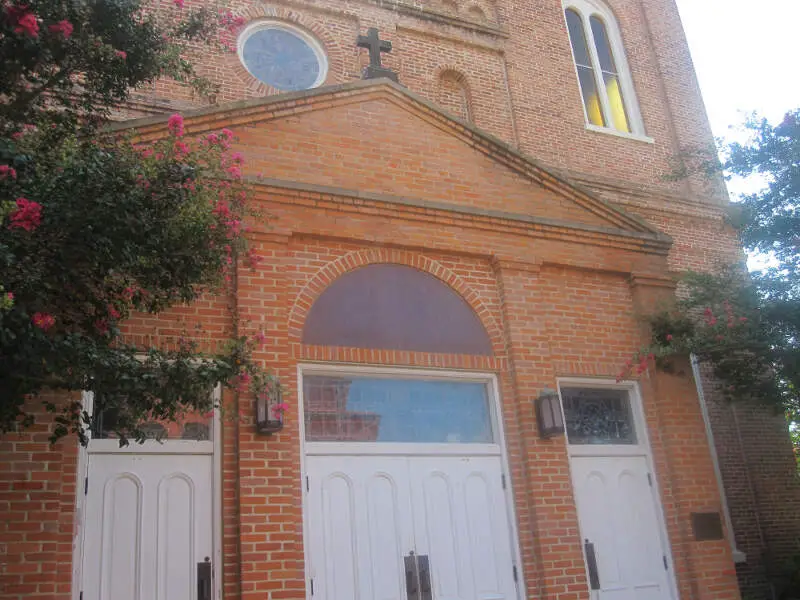
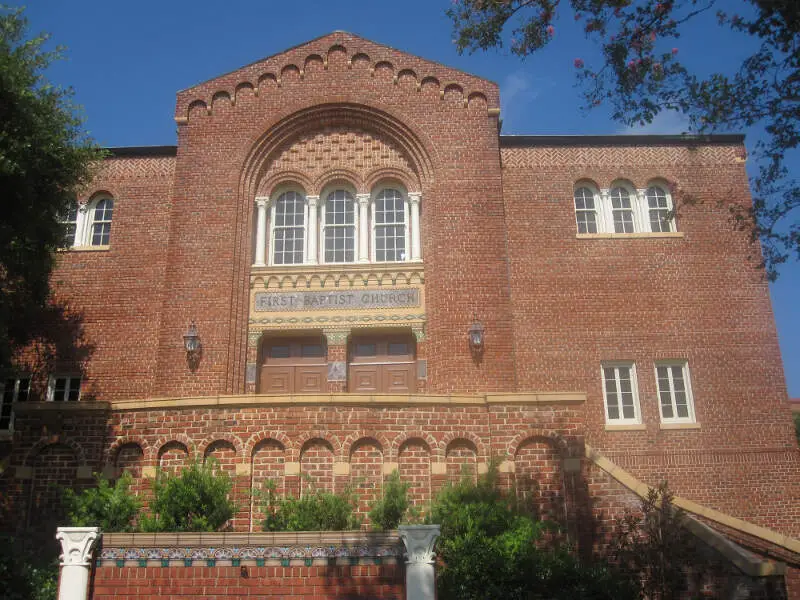
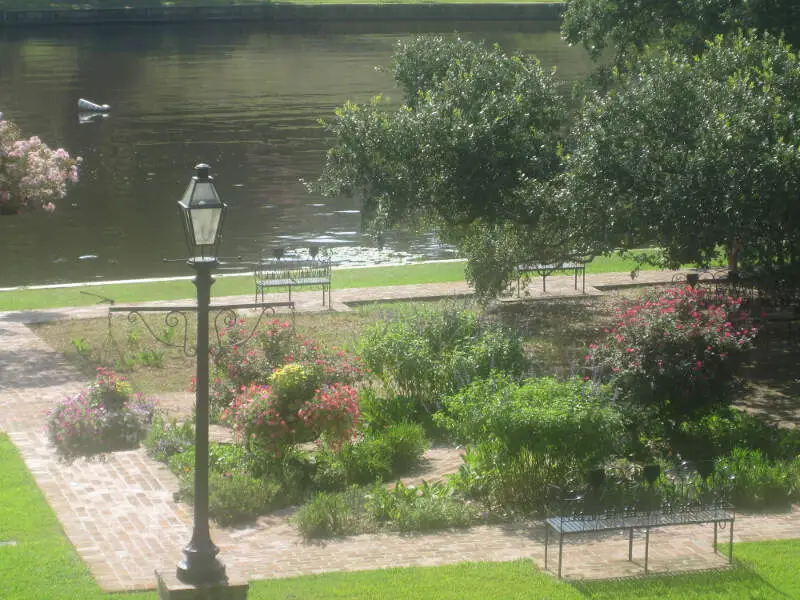
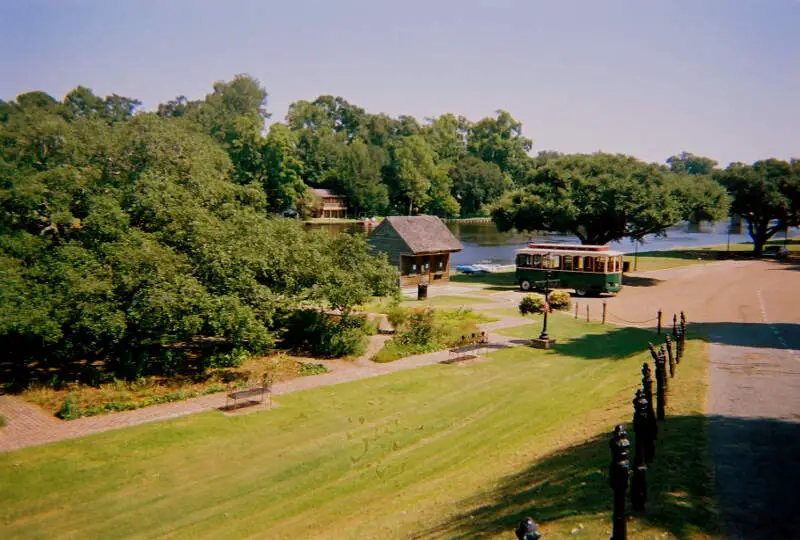
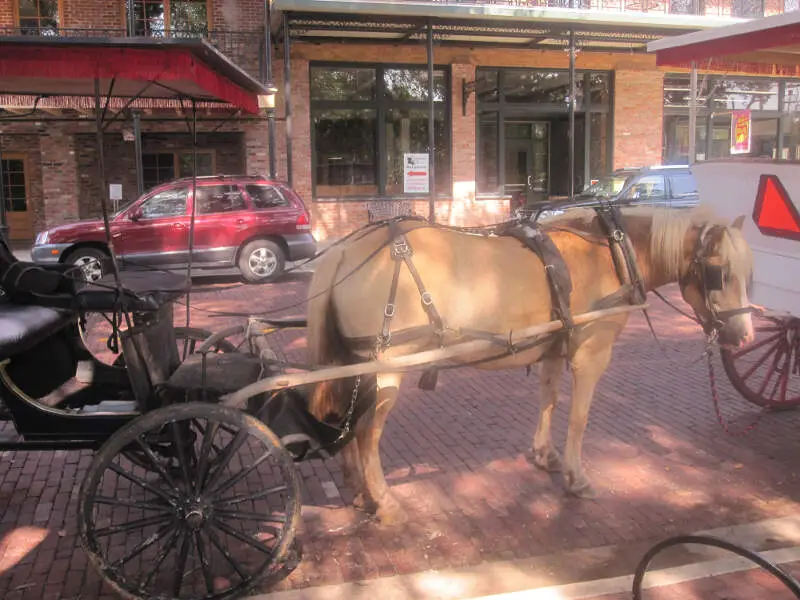
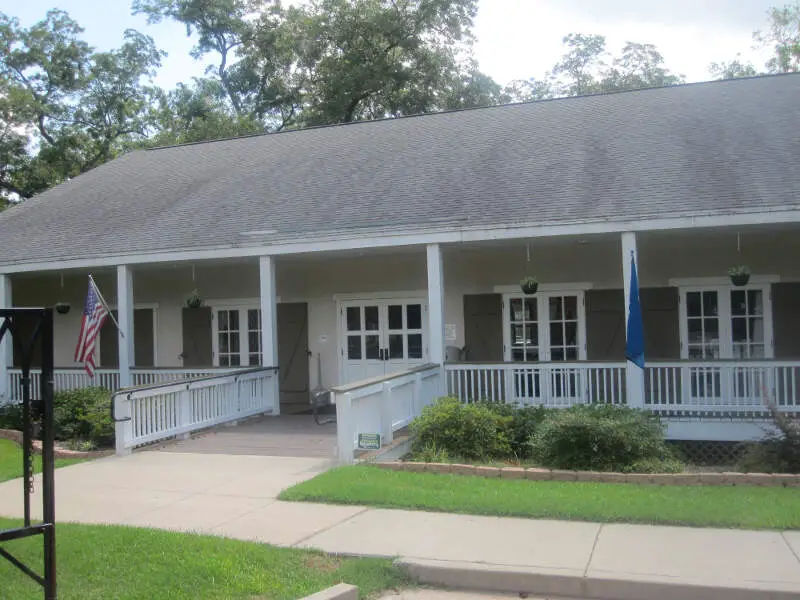
Natchitoches, LA Photos
1 Reviews & Comments About Natchitoches
/5

HomeSnacks User - 2018-08-20 22:56:05.535901
Natchitoches, Louisiana has lots of activities and festivals throughout the year. Natchitoches also has NSU, which is a college that has many degree programs for an individual to obtain a degree. My parents took me to Natchitoches since I was a little girl, therefore I have lots of special memories. I also met my fiance while attending NSU.
There are several key aspects that make Natchitoches a great city. One being Natchitoches is the oldest city in Louisiana. There are numerous historical sites visitors can tour including several plantations, Cane River Heritage, and even the Steel Magnolia house from the movie.
Natchitoches is also known for their Christmas festival. Lots of tourist come to see all the beautiful lights and festival activities. Natchitoches also is the home of the meat pie, which is one of the the official state foods of Louisiana.
The only negative thing about Natchitoches is the traffic. Since it is a fairly small city, traffic from college and tourists can be a bit heavy.
Rankings for Natchitoches in Louisiana


Locations Around Natchitoches
Map Of Natchitoches, LA
Best Places Around Natchitoches
Pineville, LA
Population 14,268
Fort Polk South, LA
Population 8,056
Alexandria, LA
Population 44,566
Leesville, LA
Population 5,610
Mansfield, LA
Population 4,653
Jamestown, ND
Population 15,774
Natchitoches Demographics And Statistics
Population over time in Natchitoches
The current population in Natchitoches is 17,682. The population has decreased -2.2% from 2010.
| Year | Population | % Change |
|---|---|---|
| 2023 | 17,682 | -1.3% |
| 2022 | 17,908 | -1.1% |
| 2021 | 18,105 | 2.2% |
| 2020 | 17,711 | -1.0% |
| 2019 | 17,898 | -1.0% |
| 2018 | 18,080 | -0.5% |
| 2017 | 18,176 | -1.2% |
| 2016 | 18,402 | -0.3% |
| 2015 | 18,460 | 0.0% |
| 2014 | 18,460 | 0.7% |
| 2013 | 18,336 | 0.4% |
| 2012 | 18,264 | 0.6% |
| 2011 | 18,156 | 0.4% |
| 2010 | 18,083 | - |
Race / Ethnicity in Natchitoches
Natchitoches is:
35.3% White with 6,249 White residents.
55.6% African American with 9,834 African American residents.
0.3% American Indian with 55 American Indian residents.
0.7% Asian with 129 Asian residents.
0.0% Hawaiian with 0 Hawaiian residents.
0.3% Other with 58 Other residents.
3.2% Two Or More with 567 Two Or More residents.
4.5% Hispanic with 790 Hispanic residents.
| Race | Natchitoches | LA | USA |
|---|---|---|---|
| White | 35.3% | 56.2% | 58.2% |
| African American | 55.6% | 30.8% | 12.0% |
| American Indian | 0.3% | 0.4% | 0.5% |
| Asian | 0.7% | 1.7% | 5.7% |
| Hawaiian | 0.0% | 0.1% | 0.2% |
| Other | 0.3% | 0.5% | 0.5% |
| Two Or More | 3.2% | 3.3% | 3.9% |
| Hispanic | 4.5% | 6.9% | 19.0% |
Gender in Natchitoches
Natchitoches is 53.0% female with 9,368 female residents.
Natchitoches is 47.0% male with 8,314 male residents.
| Gender | Natchitoches | LA | USA |
|---|---|---|---|
| Female | 53.0% | 51.0% | 50.5% |
| Male | 47.0% | 49.0% | 49.5% |
Highest level of educational attainment in Natchitoches for adults over 25
1.0% of adults in Natchitoches completed < 9th grade.
9.0% of adults in Natchitoches completed 9-12th grade.
32.0% of adults in Natchitoches completed high school / ged.
20.0% of adults in Natchitoches completed some college.
8.0% of adults in Natchitoches completed associate's degree.
16.0% of adults in Natchitoches completed bachelor's degree.
10.0% of adults in Natchitoches completed master's degree.
1.0% of adults in Natchitoches completed professional degree.
3.0% of adults in Natchitoches completed doctorate degree.
| Education | Natchitoches | LA | USA |
|---|---|---|---|
| < 9th Grade | 1.0% | 3.0% | 5.0% |
| 9-12th Grade | 9.0% | 9.0% | 6.0% |
| High School / GED | 32.0% | 33.0% | 26.0% |
| Some College | 20.0% | 21.0% | 19.0% |
| Associate's Degree | 8.0% | 7.0% | 9.0% |
| Bachelor's Degree | 16.0% | 17.0% | 21.0% |
| Master's Degree | 10.0% | 7.0% | 10.0% |
| Professional Degree | 1.0% | 2.0% | 2.0% |
| Doctorate Degree | 3.0% | 1.0% | 2.0% |
Household Income For Natchitoches, Louisiana
16.6% of households in Natchitoches earn Less than $10,000.
10.8% of households in Natchitoches earn $10,000 to $14,999.
11.3% of households in Natchitoches earn $15,000 to $24,999.
9.0% of households in Natchitoches earn $25,000 to $34,999.
10.4% of households in Natchitoches earn $35,000 to $49,999.
12.2% of households in Natchitoches earn $50,000 to $74,999.
8.7% of households in Natchitoches earn $75,000 to $99,999.
13.9% of households in Natchitoches earn $100,000 to $149,999.
4.1% of households in Natchitoches earn $150,000 to $199,999.
3.0% of households in Natchitoches earn $200,000 or more.
| Income | Natchitoches | LA | USA |
|---|---|---|---|
| Less than $10,000 | 16.6% | 7.3% | 4.9% |
| $10,000 to $14,999 | 10.8% | 5.9% | 3.6% |
| $15,000 to $24,999 | 11.3% | 9.6% | 6.6% |
| $25,000 to $34,999 | 9.0% | 8.6% | 6.8% |
| $35,000 to $49,999 | 10.4% | 11.8% | 10.4% |
| $50,000 to $74,999 | 12.2% | 15.9% | 15.7% |
| $75,000 to $99,999 | 8.7% | 11.6% | 12.7% |
| $100,000 to $149,999 | 13.9% | 14.8% | 17.4% |
| $150,000 to $199,999 | 4.1% | 7.3% | 9.3% |
| $200,000 or more | 3.0% | 7.4% | 12.6% |


