Alexandria, LA
Demographics And Statistics
Living In Alexandria, Louisiana Summary
Life in Alexandria research summary. HomeSnacks has been using Saturday Night Science to research the quality of life in Alexandria over the past nine years using Census, FBI, Zillow, and other primary data sources. Based on the most recently available data, we found the following about life in Alexandria:
The population in Alexandria is 44,566.
The median home value in Alexandria is $139,435.
The median income in Alexandria is $47,357.
The cost of living in Alexandria is 92 which is 0.9x lower than the national average.
The median rent in Alexandria is $946.
The unemployment rate in Alexandria is 6.1%.
The poverty rate in Alexandria is 26.4%.
The average high in Alexandria is 77.3° and the average low is 55.6°.
Alexandria SnackAbility
Overall SnackAbility
Alexandria, LA Crime Report
Crime in Alexandria summary. We use data from the FBI to determine the crime rates in Alexandria. Key points include:
There were 3,997 total crimes in Alexandria in the last reporting year.
The overall crime rate per 100,000 people in Alexandria is 9,309.9 / 100k people.
The violent crime rate per 100,000 people in Alexandria is 2,713.5 / 100k people.
The property crime rate per 100,000 people in Alexandria is 6,596.3 / 100k people.
Overall, crime in Alexandria is 339.30% above the national average.
Total Crimes
Above National Average
Crime In Alexandria Comparison Table
| Statistic | Count Raw |
Alexandria / 100k People |
Louisiana / 100k People |
National / 100k People |
|---|---|---|---|---|
| Total Crimes Per 100K | 3,997 | 9,309.9 | 2,816.2 | 2,119.2 |
| Violent Crime | 1,165 | 2,713.5 | 519.8 | 359.0 |
| Murder | 16 | 37.3 | 10.8 | 5.0 |
| Robbery | 70 | 163.0 | 39.4 | 61.0 |
| Aggravated Assault | 1,026 | 2,389.8 | 436.0 | 256.0 |
| Property Crime | 2,832 | 6,596.3 | 2,296.4 | 1,760.0 |
| Burglary | 373 | 868.8 | 405.4 | 229.0 |
| Larceny | 2,236 | 5,208.1 | 1,636.2 | 1,272.0 |
| Car Theft | 223 | 519.4 | 254.8 | 259.0 |
Alexandria, LA Cost Of Living
Cost of living in Alexandria summary. We use data on the cost of living to determine how expensive it is to live in Alexandria. Real estate prices drive most of the variance in cost of living around Louisiana. Key points include:
The cost of living in Alexandria is 92 with 100 being average.
The cost of living in Alexandria is 0.9x lower than the national average.
The median home value in Alexandria is $139,435.
The median income in Alexandria is $47,357.
Alexandria's Overall Cost Of Living
Lower Than The National Average
Cost Of Living In Alexandria Comparison Table
| Living Expense | Alexandria | Louisiana | National Average | |
|---|---|---|---|---|
| Overall | 92 | 90 | 100 | |
| Services | 96 | 94 | 100 | |
| Groceries | 95 | 93 | 100 | |
| Health | 85 | 100 | 100 | |
| Housing | 84 | 80 | 100 | |
| Transportation | 99 | 94 | 100 | |
| Utilities | 99 | 83 | 100 | |
Alexandria, LA Weather
The average high in Alexandria is 77.3° and the average low is 55.6°.
There are 72.1 days of precipitation each year.
Expect an average of 59.5 inches of precipitation each year with 0.2 inches of snow.
| Stat | Alexandria |
|---|---|
| Average Annual High | 77.3 |
| Average Annual Low | 55.6 |
| Annual Precipitation Days | 72.1 |
| Average Annual Precipitation | 59.5 |
| Average Annual Snowfall | 0.2 |
Average High
Days of Rain
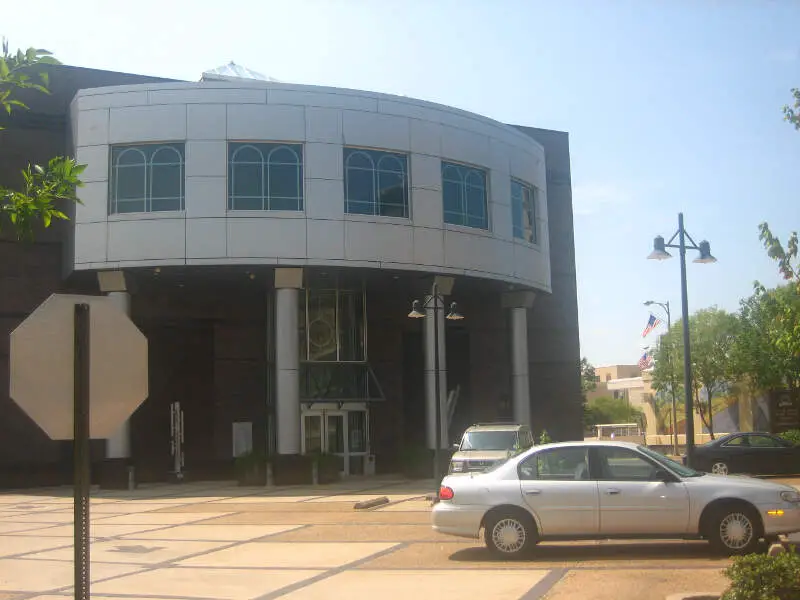
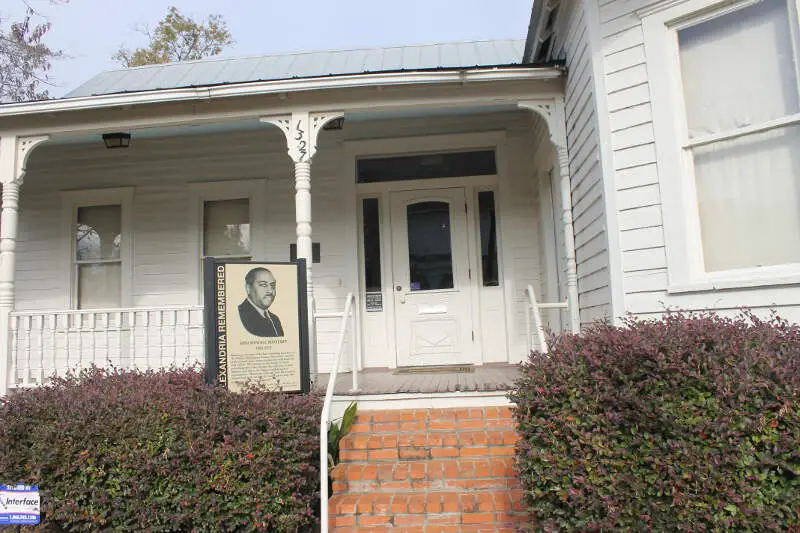
Alexandria, LA Photos


1 Reviews & Comments About Alexandria
/5

HomeSnacks User - None
I live in Alexandria, and it's much more boring than those places because there are hotels everywhere, but no attractions. And, given that, THOSE places are much more interesting than that of Alexandria.
AL is so... dystopian.
Go downtown and you will find some futureless drughead any 3 blocks you move.
Rankings for Alexandria in Louisiana


Locations Around Alexandria
Map Of Alexandria, LA
Best Places Around Alexandria
Pineville, LA
Population 14,268
Natchitoches, LA
Population 17,682
Fort Polk South, LA
Population 8,056
Oakdale, LA
Population 6,614
Leesville, LA
Population 5,610
Ville Platte, LA
Population 6,299
Marksville, LA
Population 4,964
Alexandria Demographics And Statistics
Population over time in Alexandria
The current population in Alexandria is 44,566. The population has decreased -6.3% from 2010.
| Year | Population | % Change |
|---|---|---|
| 2023 | 44,566 | -1.3% |
| 2022 | 45,133 | -1.3% |
| 2021 | 45,736 | -1.7% |
| 2020 | 46,545 | -1.0% |
| 2019 | 47,012 | -1.1% |
| 2018 | 47,539 | -0.9% |
| 2017 | 47,954 | -0.2% |
| 2016 | 48,044 | 0.1% |
| 2015 | 47,985 | 0.0% |
| 2014 | 47,983 | 0.1% |
| 2013 | 47,938 | -0.0% |
| 2012 | 47,941 | 0.4% |
| 2011 | 47,749 | 0.4% |
| 2010 | 47,568 | - |
Race / Ethnicity in Alexandria
Alexandria is:
36.1% White with 16,090 White residents.
55.8% African American with 24,877 African American residents.
0.3% American Indian with 119 American Indian residents.
2.0% Asian with 883 Asian residents.
0.0% Hawaiian with 0 Hawaiian residents.
0.2% Other with 70 Other residents.
2.4% Two Or More with 1,089 Two Or More residents.
3.2% Hispanic with 1,438 Hispanic residents.
| Race | Alexandria | LA | USA |
|---|---|---|---|
| White | 36.1% | 56.2% | 58.2% |
| African American | 55.8% | 30.8% | 12.0% |
| American Indian | 0.3% | 0.4% | 0.5% |
| Asian | 2.0% | 1.7% | 5.7% |
| Hawaiian | 0.0% | 0.1% | 0.2% |
| Other | 0.2% | 0.5% | 0.5% |
| Two Or More | 2.4% | 3.3% | 3.9% |
| Hispanic | 3.2% | 6.9% | 19.0% |
Gender in Alexandria
Alexandria is 52.9% female with 23,571 female residents.
Alexandria is 47.1% male with 20,995 male residents.
| Gender | Alexandria | LA | USA |
|---|---|---|---|
| Female | 52.9% | 51.0% | 50.5% |
| Male | 47.1% | 49.0% | 49.5% |
Highest level of educational attainment in Alexandria for adults over 25
4.0% of adults in Alexandria completed < 9th grade.
11.0% of adults in Alexandria completed 9-12th grade.
34.0% of adults in Alexandria completed high school / ged.
21.0% of adults in Alexandria completed some college.
6.0% of adults in Alexandria completed associate's degree.
14.0% of adults in Alexandria completed bachelor's degree.
6.0% of adults in Alexandria completed master's degree.
3.0% of adults in Alexandria completed professional degree.
1.0% of adults in Alexandria completed doctorate degree.
| Education | Alexandria | LA | USA |
|---|---|---|---|
| < 9th Grade | 4.0% | 3.0% | 5.0% |
| 9-12th Grade | 11.0% | 9.0% | 6.0% |
| High School / GED | 34.0% | 33.0% | 26.0% |
| Some College | 21.0% | 21.0% | 19.0% |
| Associate's Degree | 6.0% | 7.0% | 9.0% |
| Bachelor's Degree | 14.0% | 17.0% | 21.0% |
| Master's Degree | 6.0% | 7.0% | 10.0% |
| Professional Degree | 3.0% | 2.0% | 2.0% |
| Doctorate Degree | 1.0% | 1.0% | 2.0% |
Household Income For Alexandria, Louisiana
7.5% of households in Alexandria earn Less than $10,000.
7.3% of households in Alexandria earn $10,000 to $14,999.
12.6% of households in Alexandria earn $15,000 to $24,999.
11.3% of households in Alexandria earn $25,000 to $34,999.
13.2% of households in Alexandria earn $35,000 to $49,999.
16.0% of households in Alexandria earn $50,000 to $74,999.
10.6% of households in Alexandria earn $75,000 to $99,999.
10.6% of households in Alexandria earn $100,000 to $149,999.
5.3% of households in Alexandria earn $150,000 to $199,999.
5.7% of households in Alexandria earn $200,000 or more.
| Income | Alexandria | LA | USA |
|---|---|---|---|
| Less than $10,000 | 7.5% | 7.3% | 4.9% |
| $10,000 to $14,999 | 7.3% | 5.9% | 3.6% |
| $15,000 to $24,999 | 12.6% | 9.6% | 6.6% |
| $25,000 to $34,999 | 11.3% | 8.6% | 6.8% |
| $35,000 to $49,999 | 13.2% | 11.8% | 10.4% |
| $50,000 to $74,999 | 16.0% | 15.9% | 15.7% |
| $75,000 to $99,999 | 10.6% | 11.6% | 12.7% |
| $100,000 to $149,999 | 10.6% | 14.8% | 17.4% |
| $150,000 to $199,999 | 5.3% | 7.3% | 9.3% |
| $200,000 or more | 5.7% | 7.4% | 12.6% |


