Opelousas SnackAbility
Overall SnackAbility
Crime in Opelousas summary. We use data from the FBI to determine the crime rates in Opelousas. Key points include:
There were 975 total crimes in Opelousas in the last reporting year.
The overall crime rate per 100,000 people in Opelousas is 6,388.0 / 100k people.
The violent crime rate per 100,000 people in Opelousas is 1,369.3 / 100k people.
The property crime rate per 100,000 people in Opelousas is 5,018.7 / 100k people.
Overall, crime in Opelousas is 201.43% above the national average.
Total Crimes
Above National Average
Crime In Opelousas Comparison Table
| Statistic | Count Raw |
Opelousas / 100k People |
Louisiana / 100k People |
National / 100k People |
|---|---|---|---|---|
| Total Crimes Per 100K | 975 | 6,388.0 | 2,816.2 | 2,119.2 |
| Violent Crime | 209 | 1,369.3 | 519.8 | 359.0 |
| Murder | 6 | 39.3 | 10.8 | 5.0 |
| Robbery | 16 | 104.8 | 39.4 | 61.0 |
| Aggravated Assault | 180 | 1,179.3 | 436.0 | 256.0 |
| Property Crime | 766 | 5,018.7 | 2,296.4 | 1,760.0 |
| Burglary | 120 | 786.2 | 405.4 | 229.0 |
| Larceny | 596 | 3,904.9 | 1,636.2 | 1,272.0 |
| Car Theft | 50 | 327.6 | 254.8 | 259.0 |
Source: FBI Uniform Crime Reporting (2024)
Cost of living in Opelousas summary. We use data on the cost of living to determine how expensive it is to live in Opelousas. Real estate prices drive most of the variance in cost of living around Louisiana. Key points include:
The cost of living in Opelousas is 86 with 100 being average.
The cost of living in Opelousas is 0.9x lower than the national average.
The median home value in Opelousas is $123,098.
The median income in Opelousas is $32,964.
Opelousas's Overall Cost Of Living
Lower Than The National Average
Cost Of Living In Opelousas Comparison Table
| Living Expense | Opelousas | Louisiana | National Average |
|---|---|---|---|
| Overall | 86 | 91 | 100 |
| Services | 95 | 97 | 100 |
| Groceries | 94 | 97 | 100 |
| Health | 68 | 82 | 100 |
| Housing | 101 | 97 | 100 |
| Transportation | 98 | 99 | 100 |
| Utilities | 91 | 96 | 100 |
Source: Cost of living index, normalized to US average = 100
Opelousas, LA Weather
The average high in Opelousas is 78.3° and the average low is 57.7°.
There are 75.8 days of precipitation each year.
Expect an average of 62.3 inches of precipitation each year with 0.0 inches of snow.
| Stat | Opelousas |
|---|---|
| Average Annual High | 78.3 |
| Average Annual Low | 57.7 |
| Annual Precipitation Days | 75.8 |
| Average Annual Precipitation | 62.3 |
| Average Annual Snowfall | 0.0 |
Average High
Days of Rain
Source: NOAA climate normals (30-year)
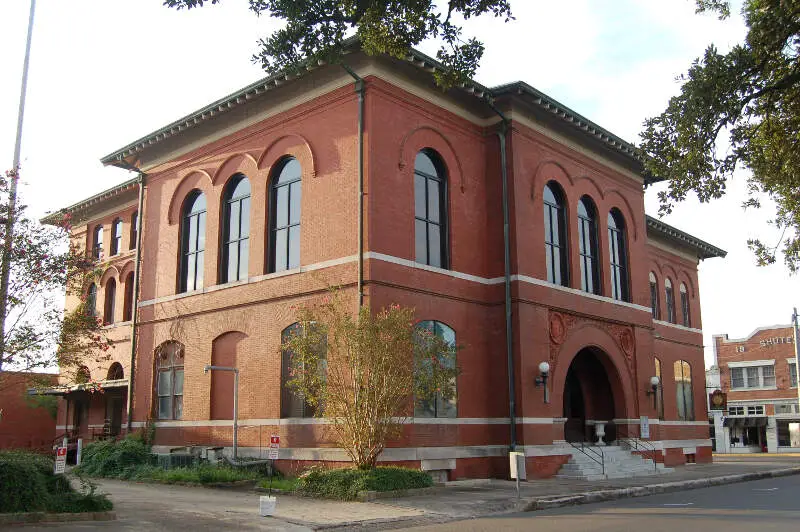
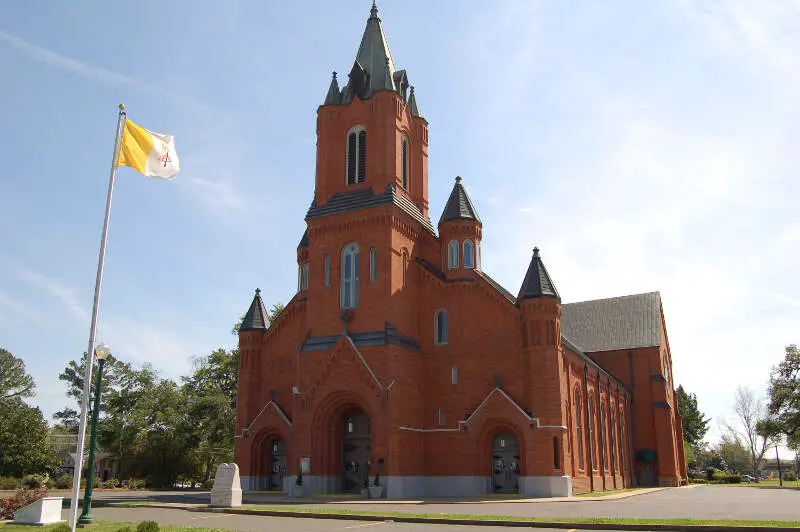
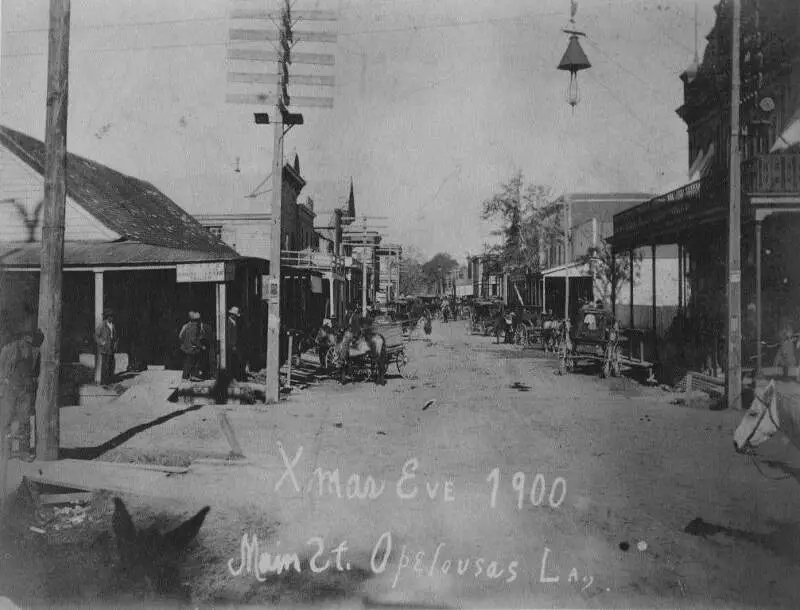
Opelousas, LA Photos
Rankings & Articles For Opelousas


Locations Around Opelousas
Map Of Opelousas, LA
Best Places Around Opelousas
Crowley, LA
Population 11,422
New Iberia, LA
Population 27,571
Abbeville, LA
Population 11,003
Jennings, LA
Population 9,553
St. Martinville, LA
Population 5,297
Oakdale, LA
Population 6,546
Lafayette, LA
Population 121,715
Eunice, LA
Population 9,239
Breaux Bridge, LA
Population 7,501
Ville Platte, LA
Population 6,253
Opelousas Demographics And Statistics
Population over time in Opelousas
The current population in Opelousas is 15,495. The population has decreased 12.8% from 2010.
| Year | Population | % Change |
|---|---|---|
| 2024 | 15,495 | -1.1% |
| 2023 | 15,662 | -0.9% |
| 2022 | 15,810 | -0.5% |
| 2021 | 15,884 | -4.8% |
| 2020 | 16,687 | 2.8% |
| 2019 | 16,234 | -1.0% |
| 2018 | 16,399 | -0.5% |
| 2017 | 16,480 | -0.8% |
| 2016 | 16,605 | -0.2% |
| 2015 | 16,638 | -0.2% |
| 2014 | 16,668 | -0.1% |
| 2013 | 16,679 | -1.5% |
| 2012 | 16,941 | -2.2% |
| 2011 | 17,314 | -2.6% |
| 2010 | 17,778 | - |
Race / Ethnicity in Opelousas
See the full breakdown
Opelousas is:
16.3% White with 2,530 White residents.
76.5% African American with 11,847 African American residents.
0.2% American Indian with 32 American Indian residents.
0.0% Asian with 4 Asian residents.
0.0% Hawaiian with 0 Hawaiian residents.
0.5% Other with 84 Other residents.
3.6% Two Or More with 555 Two Or More residents.
2.9% Hispanic with 443 Hispanic residents.
| Race | Opelousas | LA | USA |
|---|---|---|---|
| White | 16.3% | 55.7% | 57.4% |
| African American | 76.5% | 30.5% | 11.9% |
| American Indian | 0.2% | 0.4% | 0.5% |
| Asian | 0.0% | 1.7% | 5.9% |
| Hawaiian | 0.0% | 0.1% | 0.2% |
| Other | 0.5% | 0.5% | 0.6% |
| Two Or More | 3.6% | 3.8% | 4.3% |
| Hispanic | 2.9% | 7.2% | 19.3% |
Gender in Opelousas
See the full breakdown
Opelousas is 54.1% female with 8,377 female residents.
Opelousas is 45.9% male with 7,118 male residents.
| Gender | Opelousas | LA | USA |
|---|---|---|---|
| Female | 54.1% | 51.1% | 50.5% |
| Male | 45.9% | 48.9% | 49.5% |
Highest level of educational attainment in Opelousas for adults over 25
See the full breakdown
8.0% of adults in Opelousas completed < 9th grade.
13.0% of adults in Opelousas completed 9-12th grade.
40.0% of adults in Opelousas completed high school / ged.
19.0% of adults in Opelousas completed some college.
10.0% of adults in Opelousas completed associate's degree.
6.0% of adults in Opelousas completed bachelor's degree.
2.0% of adults in Opelousas completed master's degree.
1.0% of adults in Opelousas completed professional degree.
1.0% of adults in Opelousas completed doctorate degree.
| Education | Opelousas | LA | USA |
|---|---|---|---|
| < 9th Grade | 8.0% | 6.0% | 4.0% |
| 9-12th Grade | 13.0% | 8.0% | 6.0% |
| High School / GED | 40.0% | 32.0% | 26.0% |
| Some College | 19.0% | 20.0% | 19.0% |
| Associate's Degree | 10.0% | 7.0% | 9.0% |
| Bachelor's Degree | 6.0% | 17.0% | 22.0% |
| Master's Degree | 2.0% | 7.0% | 10.0% |
| Professional Degree | 1.0% | 2.0% | 2.0% |
| Doctorate Degree | 1.0% | 1.0% | 2.0% |
Household Income For Opelousas, Louisiana
See the full breakdown
14.3% of households in Opelousas earn Less than $10,000.
14.9% of households in Opelousas earn $10,000 to $14,999.
11.6% of households in Opelousas earn $15,000 to $24,999.
10.9% of households in Opelousas earn $25,000 to $34,999.
15.6% of households in Opelousas earn $35,000 to $49,999.
15.3% of households in Opelousas earn $50,000 to $74,999.
6.8% of households in Opelousas earn $75,000 to $99,999.
7.7% of households in Opelousas earn $100,000 to $149,999.
1.0% of households in Opelousas earn $150,000 to $199,999.
2.1% of households in Opelousas earn $200,000 or more.
| Income | Opelousas | LA | USA |
|---|---|---|---|
| Less than $10,000 | 14.3% | 7.2% | 5.0% |
| $10,000 to $14,999 | 14.9% | 5.8% | 3.4% |
| $15,000 to $24,999 | 11.6% | 9.4% | 6.3% |
| $25,000 to $34,999 | 10.9% | 8.4% | 6.6% |
| $35,000 to $49,999 | 15.6% | 11.8% | 10.1% |
| $50,000 to $74,999 | 15.3% | 15.9% | 15.5% |
| $75,000 to $99,999 | 6.8% | 11.7% | 12.6% |
| $100,000 to $149,999 | 7.7% | 14.8% | 17.5% |
| $150,000 to $199,999 | 1.0% | 7.3% | 9.6% |
| $200,000 or more | 2.1% | 7.8% | 13.4% |
Source: U.S. Census ACS 5-year estimates (2024)


