Bowie SnackAbility
Overall SnackAbility
Crime in Bowie summary. We use data from the FBI to determine the crime rates in Bowie. Key points include:
There were 1,408 total crimes in Bowie in the last reporting year.
The overall crime rate per 100,000 people in Bowie is 2,473.3 / 100k people.
The violent crime rate per 100,000 people in Bowie is 193.2 / 100k people.
The property crime rate per 100,000 people in Bowie is 2,280.0 / 100k people.
Overall, crime in Bowie is 16.71% above the national average.
Total Crimes
Above National Average
Crime In Bowie Comparison Table
| Statistic | Count Raw |
Bowie / 100k People |
Maryland / 100k People |
National / 100k People |
|---|---|---|---|---|
| Total Crimes Per 100K | 1,408 | 2,473.3 | 2,470.0 | 2,119.2 |
| Violent Crime | 110 | 193.2 | 420.4 | 359.0 |
| Murder | 0 | 0.0 | 7.2 | 5.0 |
| Robbery | 33 | 58.0 | 123.2 | 61.0 |
| Aggravated Assault | 57 | 100.1 | 257.0 | 256.0 |
| Property Crime | 1,298 | 2,280.0 | 2,049.6 | 1,760.0 |
| Burglary | 79 | 138.8 | 190.0 | 229.0 |
| Larceny | 1,003 | 1,761.8 | 1,446.8 | 1,272.0 |
| Car Theft | 216 | 379.4 | 412.8 | 259.0 |
Source: FBI Uniform Crime Reporting (2024)
Cost of living in Bowie summary. We use data on the cost of living to determine how expensive it is to live in Bowie. Real estate prices drive most of the variance in cost of living around Maryland. Key points include:
The cost of living in Bowie is 133 with 100 being average.
The cost of living in Bowie is 1.3x higher than the national average.
The median home value in Bowie is $524,117.
The median income in Bowie is $141,995.
Bowie's Overall Cost Of Living
Higher Than The National Average
Cost Of Living In Bowie Comparison Table
| Living Expense | Bowie | Maryland | National Average |
|---|---|---|---|
| Overall | 133 | 121 | 100 |
| Services | 103 | 104 | 100 |
| Groceries | 109 | 107 | 100 |
| Health | 200 | 152 | 100 |
| Housing | 107 | 109 | 100 |
| Transportation | 104 | 108 | 100 |
| Utilities | 105 | 109 | 100 |
Source: Cost of living index, normalized to US average = 100
Bowie, MD Weather
The average high in Bowie is 66.0° and the average low is 44.6°.
There are 71.9 days of precipitation each year.
Expect an average of 42.7 inches of precipitation each year with 14.1 inches of snow.
| Stat | Bowie |
|---|---|
| Average Annual High | 66.0 |
| Average Annual Low | 44.6 |
| Annual Precipitation Days | 71.9 |
| Average Annual Precipitation | 42.7 |
| Average Annual Snowfall | 14.1 |
Average High
Days of Rain
Source: NOAA climate normals (30-year)
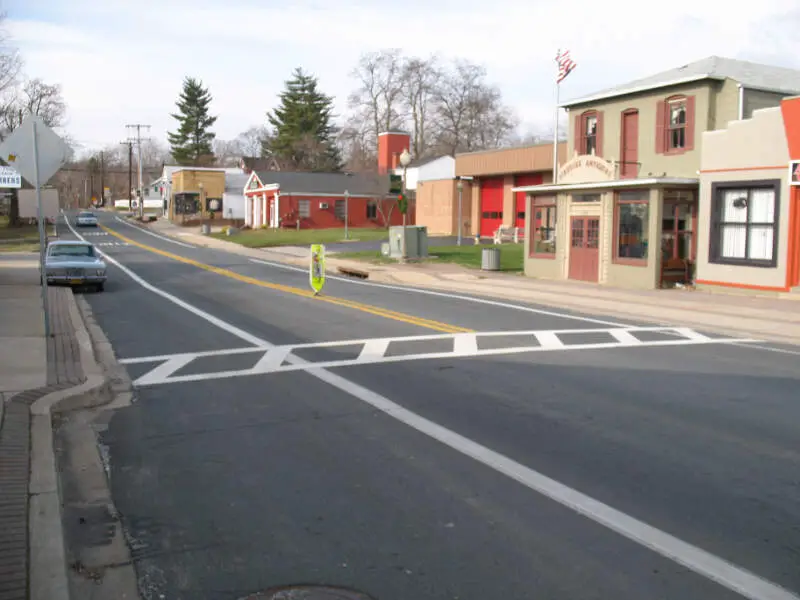
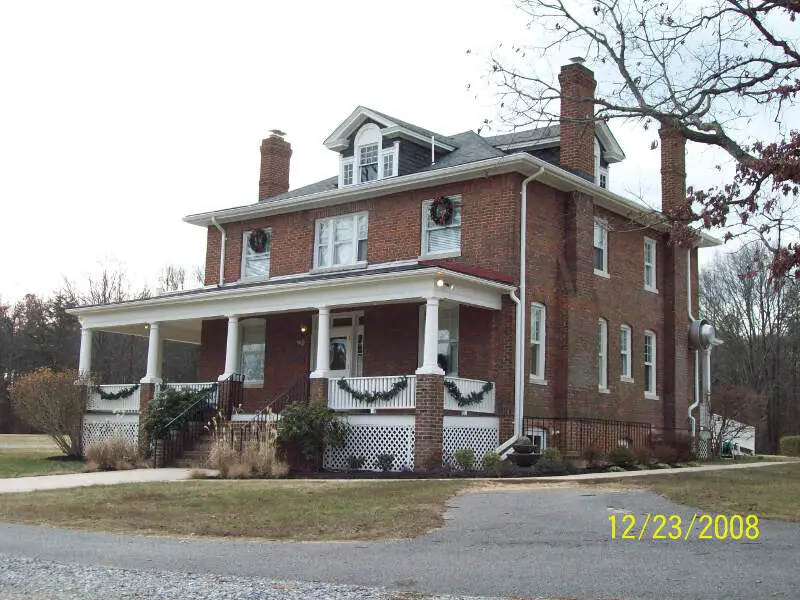
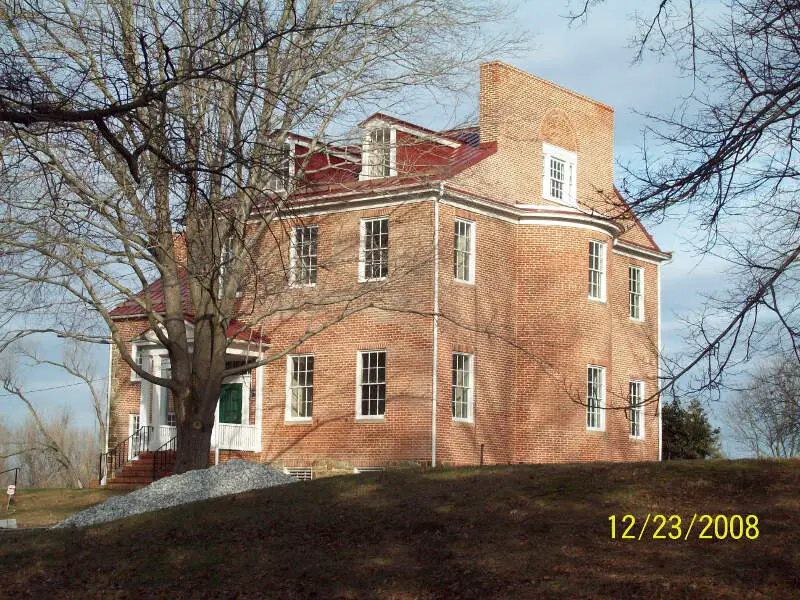
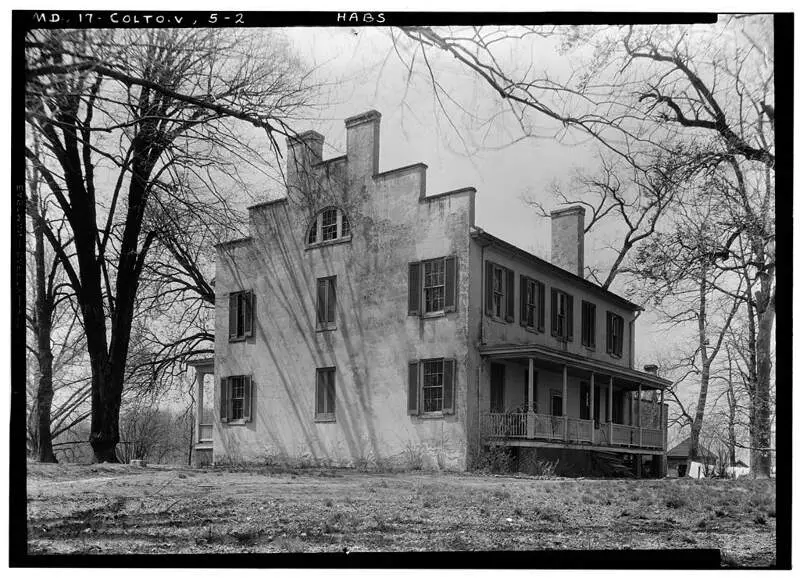
Bowie, MD Photos

1 Reviews & Comments About Bowie

I was born and raised in Bowie, md. Very nice place, but surrounded by not so good counties, loved Bowie growing up, now it's just to crowded, wish I could move some where, where it's not all built up, plus crime is going up. But it is nice, just not as nice as it was When I was young. lol.. I love OC! I've been going every year since I was 3, yea it can have some cheesy stuff, but I still love the place to vacation, us poor people can't afford to go anywhere else lol and yes it's nice that it is close lol
Rankings & Articles For Bowie


Locations Around Bowie
Map Of Bowie, MD
Best Places Around Bowie
Four Corners, MD
Population 8,150
Layhill, MD
Population 5,497
South Kensington, MD
Population 8,148
Ilchester, MD
Population 28,364
North Laurel, MD
Population 25,563
Colesville, MD
Population 14,519
Kemp Mill, MD
Population 13,042
Chevy Chase, MD
Population 9,445
Chevy Chase, MD
Population 9,445
Bowie Demographics And Statistics
Population over time in Bowie
The current population in Bowie is 57,926. The population has increased 6.7% from 2010.
| Year | Population | % Change |
|---|---|---|
| 2024 | 57,926 | 0.3% |
| 2023 | 57,771 | -0.3% |
| 2022 | 57,922 | -0.3% |
| 2021 | 58,113 | -0.1% |
| 2020 | 58,158 | -0.6% |
| 2019 | 58,481 | 0.2% |
| 2018 | 58,368 | 0.1% |
| 2017 | 58,290 | 1.1% |
| 2016 | 57,633 | 1.3% |
| 2015 | 56,885 | 1.0% |
| 2014 | 56,335 | 1.3% |
| 2013 | 55,585 | 1.0% |
| 2012 | 55,059 | 1.0% |
| 2011 | 54,523 | 0.4% |
| 2010 | 54,314 | - |
Race / Ethnicity in Bowie
See the full breakdown
Bowie is:
26.5% White with 15,341 White residents.
53.4% African American with 30,914 African American residents.
0.4% American Indian with 223 American Indian residents.
3.3% Asian with 1,884 Asian residents.
0.0% Hawaiian with 7 Hawaiian residents.
0.7% Other with 398 Other residents.
5.8% Two Or More with 3,376 Two Or More residents.
10.0% Hispanic with 5,783 Hispanic residents.
| Race | Bowie | MD | USA |
|---|---|---|---|
| White | 26.5% | 46.6% | 57.4% |
| African American | 53.4% | 28.9% | 11.9% |
| American Indian | 0.4% | 0.1% | 0.5% |
| Asian | 3.3% | 6.5% | 5.9% |
| Hawaiian | 0.0% | 0.0% | 0.2% |
| Other | 0.7% | 0.7% | 0.6% |
| Two Or More | 5.8% | 4.6% | 4.3% |
| Hispanic | 10.0% | 12.5% | 19.3% |
Gender in Bowie
See the full breakdown
Bowie is 52.2% female with 30,239 female residents.
Bowie is 47.8% male with 27,687 male residents.
| Gender | Bowie | MD | USA |
|---|---|---|---|
| Female | 52.2% | 51.3% | 50.5% |
| Male | 47.8% | 48.7% | 49.5% |
Highest level of educational attainment in Bowie for adults over 25
See the full breakdown
2.0% of adults in Bowie completed < 9th grade.
4.0% of adults in Bowie completed 9-12th grade.
18.0% of adults in Bowie completed high school / ged.
18.0% of adults in Bowie completed some college.
7.0% of adults in Bowie completed associate's degree.
26.0% of adults in Bowie completed bachelor's degree.
19.0% of adults in Bowie completed master's degree.
3.0% of adults in Bowie completed professional degree.
3.0% of adults in Bowie completed doctorate degree.
| Education | Bowie | MD | USA |
|---|---|---|---|
| < 9th Grade | 2.0% | 4.0% | 4.0% |
| 9-12th Grade | 4.0% | 5.0% | 6.0% |
| High School / GED | 18.0% | 23.0% | 26.0% |
| Some College | 18.0% | 17.0% | 19.0% |
| Associate's Degree | 7.0% | 7.0% | 9.0% |
| Bachelor's Degree | 26.0% | 23.0% | 22.0% |
| Master's Degree | 19.0% | 15.0% | 10.0% |
| Professional Degree | 3.0% | 3.0% | 2.0% |
| Doctorate Degree | 3.0% | 3.0% | 2.0% |
Household Income For Bowie, Maryland
See the full breakdown
3.0% of households in Bowie earn Less than $10,000.
0.8% of households in Bowie earn $10,000 to $14,999.
2.1% of households in Bowie earn $15,000 to $24,999.
1.7% of households in Bowie earn $25,000 to $34,999.
4.6% of households in Bowie earn $35,000 to $49,999.
9.1% of households in Bowie earn $50,000 to $74,999.
9.3% of households in Bowie earn $75,000 to $99,999.
22.5% of households in Bowie earn $100,000 to $149,999.
19.2% of households in Bowie earn $150,000 to $199,999.
27.6% of households in Bowie earn $200,000 or more.
| Income | Bowie | MD | USA |
|---|---|---|---|
| Less than $10,000 | 3.0% | 4.4% | 5.0% |
| $10,000 to $14,999 | 0.8% | 2.4% | 3.4% |
| $15,000 to $24,999 | 2.1% | 4.3% | 6.3% |
| $25,000 to $34,999 | 1.7% | 4.9% | 6.6% |
| $35,000 to $49,999 | 4.6% | 7.5% | 10.1% |
| $50,000 to $74,999 | 9.1% | 12.8% | 15.5% |
| $75,000 to $99,999 | 9.3% | 11.9% | 12.6% |
| $100,000 to $149,999 | 22.5% | 18.9% | 17.5% |
| $150,000 to $199,999 | 19.2% | 12.5% | 9.6% |
| $200,000 or more | 27.6% | 20.3% | 13.4% |
Source: U.S. Census ACS 5-year estimates (2024)


