100 Biggest Cities In Maryland For 2026
Using the latest Census data, we detail the 100 biggest cities in Maryland. You can all see a comprehensive list of all 319 cities and places in Maryland.

We all love the biggest cities that the Old Line State has to offer. You know the places like Baltimore and Columbia which make all the headlines.
But there are a bunch of other great large cities in Maryland that don't get as much love.
We're going to change that right now.
Using the most recent Census data, we can tell you about all the places in Maryland with a focus on the biggest. We update the data each year and this is our fourth time doing this.
Table Of Contents: Top Ten | Methodology | Table
The Largest Cities In Maryland For 2026:
You can click here to see a full table of the full of the 100 biggest cities in Maryland, along with every other place over 1,000 people big. It is sortable by clicking on the headers.
Read on below to see more on the biggest cities. Or for more reading on places to live in Maryland, check out:
- Best Places To Live In Maryland
- Cheapest Places To Live In Maryland
- Most Dangerous Cities In Maryland
The 10 Biggest Cities In Maryland

/10
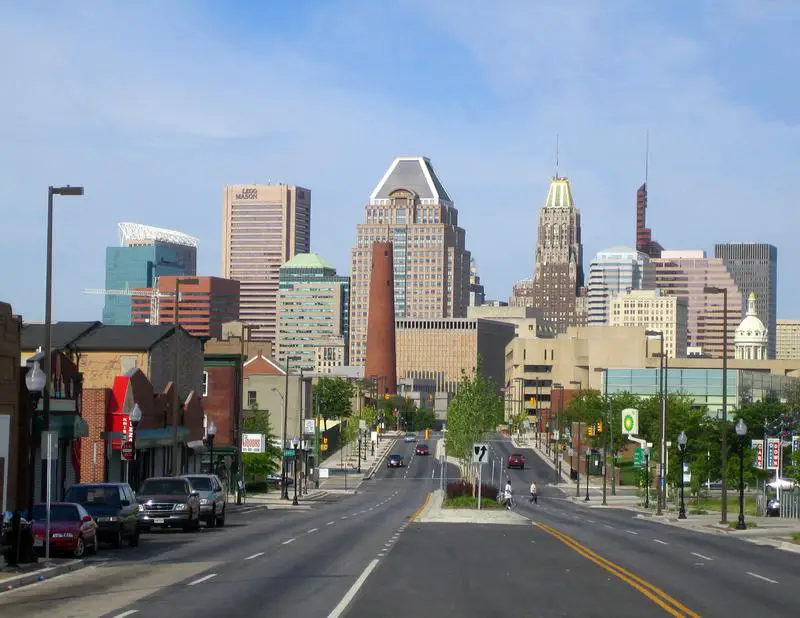
Rank Last Year: 1 (No Change)
Population: 573,243.0
Population 2010: 620,538
Growth: -7.6%
More on Baltimore: Data | Crime | Cost Of Living | Real Estate

/10
Rank Last Year: 2 (No Change)
Population: 104,338.0
Population 2010: 98,379
Growth: 6.1%
More on Columbia: Data | Cost Of Living | Real Estate

/10
Rank Last Year: 3 (No Change)
Population: 90,719.0
Population 2010: 84,847
Growth: 6.9%
More on Germantown: Data | Cost Of Living | Real Estate

/10
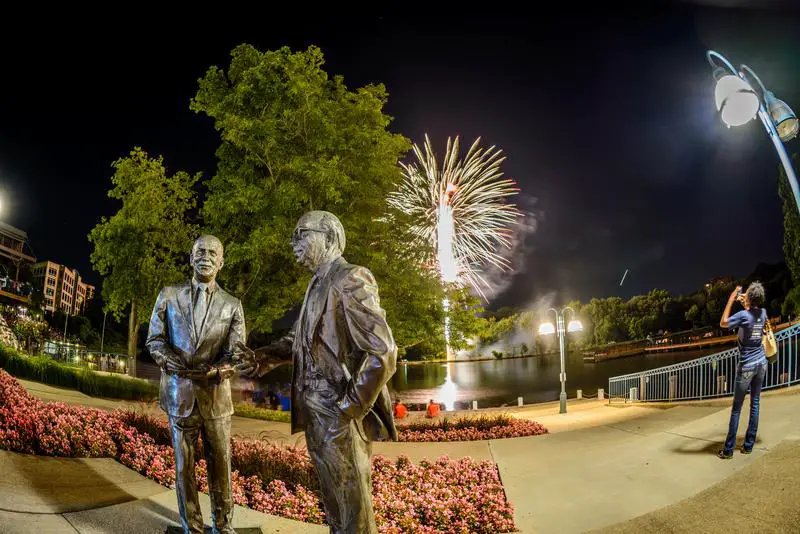
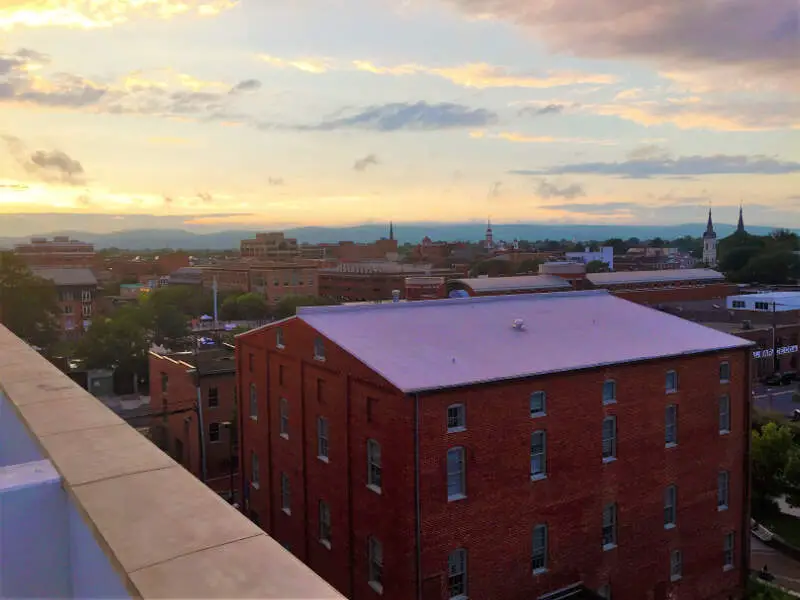
Rank Last Year: 6 (Up 2)
Population: 83,395.0
Population 2010: 63,731
Growth: 30.9%
More on Frederick: Data | Crime | Cost Of Living | Real Estate

/10
Rank Last Year: 4 (Down 1)
Population: 82,943.0
Population 2010: 67,143
Growth: 23.5%
More on Waldorf: Data | Cost Of Living | Real Estate

/10
Rank Last Year: 5 (Down 1)
Population: 81,462.0
Population 2010: 70,049
Growth: 16.3%
More on Silver Spring: Data | Cost Of Living | Real Estate

/10
Rank Last Year: 7 (No Change)
Population: 75,257.0
Population 2010: 64,970
Growth: 15.8%
More on Ellicott City: Data | Cost Of Living | Real Estate

/10
Rank Last Year: 8 (No Change)
Population: 72,590.0
Population 2010: 65,523
Growth: 10.8%
More on Glen Burnie: Data | Cost Of Living | Real Estate

/10
Rank Last Year: 9 (No Change)
Population: 69,825.0
Population 2010: 58,169
Growth: 20.0%
More on Gaithersburg: Data | Cost Of Living | Real Estate

/10
Rank Last Year: 10 (No Change)
Population: 69,397.0
Population 2010: 58,537
Growth: 18.6%
More on Bethesda: Data | Cost Of Living | Real Estate
How We Determined The Largest Cities In Maryland
We've been ranking and dissecting cities in the Old Line State for over 4 years now -- making this actually the fourth time we've run the numbers. We always use the best data, the US Census. In this case, that means we are using the American Community Survey.
It what is probably the most simple analysis we run each year, we ranked every place in Maryland from biggest to smallest. The biggest city this year? That would be Baltimore.
The smallest? Martin'S Additions, although there are places smaller than 1,000 people not listed here, so keep that in mind as we take a look at the top ten.
Now on to numbers 11-100 Biggest in Maryland
We hope that you find the big city, or really any city, that's right for you. Below is a list of the rest of the biggest cities along with every other place in Maryland.
Have fun snacking around in the Old Line State!
For more reading on Maryland, check out:
- Best Places To Raise A Family In Maryland
- Best Places To Retire In Maryland
- Richest Cities In Maryland
- Safest Places In Maryland
- Worst Places To Live In Maryland
- Most Expensive Places To Live In Maryland
Detailed List Of The Biggest Cities In Maryland
| Rank | City | Current Population | 2010 | Growth | |||||
|---|---|---|---|---|---|---|---|---|---|
| 1 | Baltimore | 573,243.0 | 620,538 | -7.6% | |||||
| 2 | Columbia | 104,338.0 | 98,379 | 6.1% | |||||
| 3 | Germantown | 90,719.0 | 84,847 | 6.9% | |||||
| 4 | Frederick | 83,395.0 | 63,731 | 30.9% | |||||
| 5 | Waldorf | 82,943.0 | 67,143 | 23.5% | |||||
| 6 | Silver Spring | 81,462.0 | 70,049 | 16.3% | |||||
| 7 | Ellicott City | 75,257.0 | 64,970 | 15.8% | |||||
| 8 | Glen Burnie | 72,590.0 | 65,523 | 10.8% | |||||
| 9 | Gaithersburg | 69,825.0 | 58,169 | 20.0% | |||||
| 10 | Bethesda | 69,397.0 | 58,537 | 18.6% | |||||
| 11 | Rockville | 67,671.0 | 58,300 | 16.1% | |||||
| 12 | Dundalk | 65,969.0 | 62,444 | 5.6% | |||||
| 13 | Towson | 58,679.0 | 54,068 | 8.5% | |||||
| 14 | Severn | 58,402.0 | 41,753 | 39.9% | |||||
| 15 | Bel Air South | 58,137.0 | 45,769 | 27.0% | |||||
| 16 | Bowie | 57,926.0 | 54,314 | 6.7% | |||||
| 17 | Aspen Hill | 53,279.0 | 47,023 | 13.3% | |||||
| 18 | Wheaton | 52,926.0 | 45,079 | 17.4% | |||||
| 19 | North Bethesda | 49,677.0 | 40,489 | 22.7% | |||||
| 20 | Potomac | 45,902.0 | 44,785 | 2.5% | |||||
| 21 | Odenton | 45,002.0 | 35,399 | 27.1% | |||||
| 22 | Hagerstown | 43,665.0 | 39,546 | 10.4% | |||||
| 23 | Catonsville | 43,368.0 | 41,866 | 3.6% | |||||
| 24 | Annapolis | 40,720.0 | 37,825 | 7.7% | |||||
| 25 | Essex | 40,580.0 | 38,790 | 4.6% | |||||
| 26 | Severna Park | 40,228.0 | 37,079 | 8.5% | |||||
| 27 | Clinton | 38,376.0 | 35,985 | 6.6% | |||||
| 28 | Owings Mills | 37,245.0 | 29,734 | 25.3% | |||||
| 29 | Randallstown | 35,957.0 | 32,570 | 10.4% | |||||
| 30 | Olney | 35,797.0 | 33,167 | 7.9% | |||||
| 31 | Chillum | 34,871.0 | 35,034 | -0.5% | |||||
| 32 | College Park | 34,540.0 | 29,596 | 16.7% | |||||
| 33 | Pasadena | 34,309.0 | 22,189 | 54.6% | |||||
| 34 | Montgomery Village | 34,110.0 | 31,714 | 7.6% | |||||
| 35 | Pikesville | 33,524.0 | 30,720 | 9.1% | |||||
| 36 | Salisbury | 33,285.0 | 29,343 | 13.4% | |||||
| 37 | Middle River | 31,712.0 | 23,799 | 33.2% | |||||
| 38 | Eldersburg | 31,695.0 | 31,632 | 0.2% | |||||
| 39 | Bel Air North | 31,302.0 | 29,172 | 7.3% | |||||
| 40 | Milford Mill | 30,829.0 | 28,767 | 7.2% | |||||
| 41 | Parkville | 30,549.0 | 30,156 | 1.3% | |||||
| 42 | Clarksburg | 30,487.0 | 10,543 | 189.2% | |||||
| 43 | Laurel | 29,798.0 | 24,433 | 22.0% | |||||
| 44 | Crofton | 29,549.0 | 27,624 | 7.0% | |||||
| 45 | South Laurel | 29,272.0 | 25,742 | 13.7% | |||||
| 46 | Perry Hall | 29,105.0 | 28,368 | 2.6% | |||||
| 47 | Ilchester | 28,364.0 | 22,907 | 23.8% | |||||
| 48 | Carney | 28,343.0 | 27,583 | 2.8% | |||||
| 49 | Lochearn | 27,074.0 | 25,720 | 5.3% | |||||
| 50 | Ballenger Creek | 26,390.0 | 19,137 | 37.9% | |||||
| 51 | Elkridge | 26,283.0 | 13,512 | 94.5% | |||||
| 52 | Fairland | 26,231.0 | 23,086 | 13.6% | |||||
| 53 | Reisterstown | 25,582.0 | 26,947 | -5.1% | |||||
| 54 | North Laurel | 25,563.0 | 4,076 | 527.2% | |||||
| 55 | Fort Washington | 25,134.0 | 25,145 | -0.0% | |||||
| 56 | Edgewood | 24,922.0 | 25,391 | -1.8% | |||||
| 57 | Greenbelt | 24,678.0 | 22,817 | 8.2% | |||||
| 58 | Landover | 24,514.0 | 23,540 | 4.1% | |||||
| 59 | Arnold | 24,303.0 | 22,483 | 8.1% | |||||
| 60 | Cockeysville | 23,962.0 | 19,842 | 20.8% | |||||
| 61 | North Potomac | 23,922.0 | 25,025 | -4.4% | |||||
| 62 | Suitland | 23,793.0 | 25,240 | -5.7% | |||||
| 63 | Camp Springs | 22,544.0 | 18,770 | 20.1% | |||||
| 64 | Arbutus | 22,507.0 | 20,406 | 10.3% | |||||
| 65 | Langley Park | 21,508.0 | 18,159 | 18.4% | |||||
| 66 | Hyattsville | 20,966.0 | 17,254 | 21.5% | |||||
| 67 | Westminster | 20,445.0 | 18,591 | 10.0% | |||||
| 68 | Rosedale | 20,002.0 | 19,044 | 5.0% | |||||
| 69 | Maryland City | 19,186.0 | 15,420 | 24.4% | |||||
| 70 | Beltsville | 19,176.0 | 15,444 | 24.2% | |||||
| 71 | Cumberland | 18,804.0 | 20,927 | -10.1% | |||||
| 72 | Redland | 18,665.0 | 16,938 | 10.2% | |||||
| 73 | East Riverdale | 18,336.0 | 15,669 | 17.0% | |||||
| 74 | Seabrook | 18,317.0 | 15,620 | 17.3% | |||||
| 75 | Lake Shore | 18,249.0 | 18,880 | -3.3% | |||||
| 76 | Oxon Hill | 17,893.0 | 18,417 | -2.8% | |||||
| 77 | Damascus | 17,640.0 | 15,520 | 13.7% | |||||
| 78 | Takoma Park | 17,632.0 | 16,853 | 4.6% | |||||
| 79 | Calverton | 17,624.0 | 17,800 | -1.0% | |||||
| 80 | Ferndale | 17,529.0 | 17,104 | 2.5% | |||||
| 81 | Adelphi | 17,395.0 | 15,040 | 15.7% | |||||
| 82 | White Oak | 17,329.0 | 16,659 | 4.0% | |||||
| 83 | Easton | 17,308.0 | 15,310 | 13.1% | |||||
| 84 | Aberdeen | 17,298.0 | 14,920 | 15.9% | |||||
| 85 | Parole | 17,229.0 | 14,894 | 15.7% | |||||
| 86 | Glenmont | 17,208.0 | 13,458 | 27.9% | |||||
| 87 | Glassmanor | 16,981.0 | 17,536 | -3.2% | |||||
| 88 | Cloverly | 16,646.0 | 15,413 | 8.0% | |||||
| 89 | Brooklyn Park | 16,067.0 | 14,178 | 13.3% | |||||
| 90 | Mays Chapel | 16,066.0 | 11,965 | 34.3% | |||||
| 91 | Hillcrest Heights | 16,063.0 | 15,910 | 1.0% | |||||
| 92 | Rossville | 16,059.0 | 15,072 | 6.5% | |||||
| 93 | Elkton | 15,910.0 | 15,029 | 5.9% | |||||
| 94 | Bensville | 15,848.0 | 11,693 | 35.5% | |||||
| 95 | Summerfield | 15,065.0 | 11,134 | 35.3% | |||||
| 96 | Havre De Grace | 14,994.0 | 12,792 | 17.2% | |||||
| 97 | Colesville | 14,519.0 | 14,198 | 2.3% | |||||
| 98 | Linganore | 14,444.0 | 8,309 | 73.8% | |||||
| 99 | Accokeek | 14,362.0 | 10,513 | 36.6% | |||||
| 100 | Lake Arbor | 14,335.0 | 10,309 | 39.1% | |||||
| 101 | Urbana | 14,260.0 | 7,294 | 95.5% | |||||
| 102 | Joppatowne | 14,237.0 | 12,662 | 12.4% | |||||
| 103 | Kettering | 14,014.0 | 12,545 | 11.7% | |||||
| 104 | Glenn Dale | 13,772.0 | 14,129 | -2.5% | |||||
| 105 | Brock Hall | 13,615.0 | 8,153 | 67.0% | |||||
| 106 | New Carrollton | 13,564.0 | 12,123 | 11.9% | |||||
| 107 | Lexington Park | 13,252.0 | 10,882 | 21.8% | |||||
| 108 | Westphalia | 13,228.0 | 6,095 | 117.0% | |||||
| 109 | Cambridge | 13,152.0 | 12,109 | 8.6% | |||||
| 110 | California | 13,136.0 | 11,970 | 9.7% | |||||
| 111 | Kemp Mill | 13,042.0 | 12,084 | 7.9% | |||||
| 112 | Overlea | 13,035.0 | 12,672 | 2.9% | |||||
| 113 | Rosaryville | 12,883.0 | 11,479 | 12.2% | |||||
| 114 | Ocean Pines | 12,351.0 | 11,025 | 12.0% | |||||
| 115 | Largo | 12,229.0 | 11,012 | 11.1% | |||||
| 116 | Riviera Beach | 12,192.0 | 11,813 | 3.2% | |||||
| 117 | Brandywine | 12,160.0 | 6,018 | 102.1% | |||||
| 118 | Annapolis Neck | 12,032.0 | 11,105 | 8.3% | |||||
| 119 | Travilah | 11,721.0 | 12,063 | -2.8% | |||||
| 120 | Lanham | 11,433.0 | 8,931 | 28.0% | |||||
| 121 | Mitchellville | 11,359.0 | 11,653 | -2.5% | |||||
| 122 | Linthicum | 11,313.0 | 10,444 | 8.3% | |||||
| 123 | Fort Meade | 11,225.0 | 10,910 | 2.9% | |||||
| 124 | Friendly | 11,119.0 | 9,968 | 11.5% | |||||
| 125 | White Marsh | 10,932.0 | 9,520 | 14.8% | |||||
| 126 | Walker Mill | 10,931.0 | 11,575 | -5.6% | |||||
| 127 | Halfway | 10,849.0 | 10,119 | 7.2% | |||||
| 128 | La Plata | 10,683.0 | 8,496 | 25.7% | |||||
| 129 | Bel Air | 10,585.0 | 10,167 | 4.1% | |||||
| 130 | Scaggsville | 10,564.0 | 22,995 | -54.1% | |||||
| 131 | Forestville | 10,495.0 | 12,297 | -14.7% | |||||
| 132 | Timonium | 10,304.0 | 9,773 | 5.4% | |||||
| 133 | Marlton | 10,222.0 | 9,012 | 13.4% | |||||
| 134 | Burtonsville | 10,203.0 | 9,233 | 10.5% | |||||
| 135 | Fallston | 10,013.0 | 8,062 | 24.2% | |||||
| 136 | Jessup | 9,931.0 | 11,078 | -10.4% | |||||
| 137 | Mount Airy | 9,805.0 | 8,921 | 9.9% | |||||
| 138 | Coral Hills | 9,756.0 | 9,653 | 1.1% | |||||
| 139 | Bladensburg | 9,583.0 | 8,918 | 7.5% | |||||
| 140 | Garrison | 9,469.0 | 7,622 | 24.2% | |||||
| 141 | Chevy Chase | 9,445.0 | 9,741 | -3.0% | |||||
| 142 | Marlboro Village | 9,382.0 | 9,365 | 0.2% | |||||
| 143 | Bryans Road | 9,371.0 | 7,552 | 24.1% | |||||
| 144 | Chesapeake Ranch Estates | 9,241.0 | 9,735 | -5.1% | |||||
| 145 | Cape St. Claire | 9,236.0 | 8,670 | 6.5% | |||||
| 146 | Edgemere | 9,061.0 | 9,053 | 0.1% | |||||
| 147 | Temple Hills | 8,969.0 | 7,639 | 17.4% | |||||
| 148 | North Kensington | 8,954.0 | 9,623 | -7.0% | |||||
| 149 | Leisure World | 8,882.0 | 8,666 | 2.5% | |||||
| 150 | Stevensville | 8,802.0 | 6,813 | 29.2% | |||||
| 151 | Mayo | 8,694.0 | 7,776 | 11.8% | |||||
| 152 | Edgewater | 8,519.0 | 8,692 | -2.0% | |||||
| 153 | Brunswick | 8,450.0 | 5,770 | 46.4% | |||||
| 154 | Mount Rainier | 8,245.0 | 8,149 | 1.2% | |||||
| 155 | Savage | 8,239.0 | 6,789 | 21.4% | |||||
| 156 | Baltimore Highlands | 8,206.0 | 7,319 | 12.1% | |||||
| 157 | Four Corners | 8,150.0 | 7,998 | 1.9% | |||||
| 158 | South Kensington | 8,148.0 | 8,149 | -0.0% | |||||
| 159 | Robinwood | 8,042.0 | 8,056 | -0.2% | |||||
| 160 | Taneytown | 7,932.0 | 6,566 | 20.8% | |||||
| 161 | Lansdowne | 7,876.0 | 8,629 | -8.7% | |||||
| 162 | Fairwood | 7,526.0 | 4,650 | 61.8% | |||||
| 163 | Riverdale Park | 7,270.0 | 6,893 | 5.5% | |||||
| 164 | Darnestown | 7,051.0 | 6,502 | 8.4% | |||||
| 165 | Bowleys Quarters | 7,006.0 | 6,607 | 6.0% | |||||
| 166 | Frostburg | 6,977.0 | 8,792 | -20.6% | |||||
| 167 | Ocean City | 6,903.0 | 7,194 | -4.0% | |||||
| 168 | Forest Glen | 6,840.0 | 6,182 | 10.6% | |||||
| 169 | Riverside | 6,585.0 | 6,543 | 0.6% | |||||
| 170 | Lutherville | 6,574.0 | 6,227 | 5.6% | |||||
| 171 | Fountainhead-Orchard Hills | 6,567.0 | 6,006 | 9.3% | |||||
| 172 | Chesapeake Beach | 6,456.0 | 5,396 | 19.6% | |||||
| 173 | Walkersville | 6,414.0 | 5,743 | 11.7% | |||||
| 174 | Glenarden | 6,344.0 | 6,069 | 4.5% | |||||
| 175 | Thurmont | 6,254.0 | 6,127 | 2.1% | |||||
| 176 | Hampstead | 6,251.0 | 6,203 | 0.8% | |||||
| 177 | Cheverly | 6,096.0 | 6,234 | -2.2% | |||||
| 178 | Spring Ridge | 5,922.0 | 5,867 | 0.9% | |||||
| 179 | District Heights | 5,891.0 | 5,858 | 0.6% | |||||
| 180 | Fruitland | 5,801.0 | 4,704 | 23.3% | |||||
| 181 | Poolesville | 5,764.0 | 4,889 | 17.9% | |||||
| 182 | Fulton | 5,677.0 | 1,966 | 188.8% | |||||
| 183 | Ashton-Sandy Spring | 5,630.0 | 5,350 | 5.2% | |||||
| 184 | Cheste | 5,594.0 | 5,162 | 8.4% | |||||
| 185 | Layhill | 5,497.0 | 5,678 | -3.2% | |||||
| 186 | Marlow Heights | 5,456.0 | 6,344 | -14.0% | |||||
| 187 | Manchester | 5,439.0 | 4,597 | 18.3% | |||||
| 188 | Hampton | 5,372.0 | 4,888 | 9.9% | |||||
| 189 | Deale | 5,333.0 | 4,934 | 8.1% | |||||
| 190 | Peppermill Village | 5,238.0 | 4,842 | 8.2% | |||||
| 191 | Berlin | 5,232.0 | 4,358 | 20.1% | |||||
| 192 | Springdale | 5,226.0 | 2,522 | 107.2% | |||||
| 193 | West Ocean City | 5,198.0 | 4,541 | 14.5% | |||||
| 194 | Silver Hill | 5,193.0 | 6,104 | -14.9% | |||||
| 195 | Cresaptown | 5,121.0 | 3,459 | 48.0% | |||||
| 196 | Hillandale | 5,060.0 | 6,405 | -21.0% | |||||
| 197 | Middl | 5,014.0 | 3,894 | 28.8% | |||||
| 198 | Riva | 4,976.0 | 3,927 | 26.7% | |||||
| 199 | Denton | 4,936.0 | 4,204 | 17.4% | |||||
| 200 | St. James | 4,824.0 | 3,056 | 57.9% | |||||
| 201 | Leonar | 4,808.0 | 2,770 | 73.6% | |||||
| 202 | Chester | 4,797.0 | 4,142 | 15.8% | |||||
| 203 | Centreville | 4,761.0 | 3,937 | 20.9% | |||||
| 204 | Shady Side | 4,727.0 | 5,885 | -19.7% | |||||
| 205 | Kingsville | 4,687.0 | 4,690 | -0.1% | |||||
| 206 | Woodmore | 4,613.0 | 3,501 | 31.8% | |||||
| 207 | Sykesville | 4,491.0 | 4,454 | 0.8% | |||||
| 208 | Seat Pleasant | 4,489.0 | 4,612 | -2.7% | |||||
| 209 | National Harbor | 4,454.0 | 3,127 | 42.4% | |||||
| 210 | Perryville | 4,447.0 | 4,311 | 3.2% | |||||
| 211 | West Laurel | 4,428.0 | 4,741 | -6.6% | |||||
| 212 | Pocomoke City | 4,405.0 | 4,216 | 4.5% | |||||
| 213 | Delmar | 4,261.0 | 2,834 | 50.4% | |||||
| 214 | La Vale | 4,196.0 | 3,765 | 11.4% | |||||
| 215 | North East | 4,134.0 | 3,492 | 18.4% | |||||
| 216 | Indian Head | 4,055.0 | 3,832 | 5.8% | |||||
| 217 | Capitol Heights | 4,020.0 | 4,298 | -6.5% | |||||
| 218 | Friendship Heights Village | 4,002.0 | 5,768 | -30.6% | |||||
| 219 | Marlboro Meadows | 3,929.0 | 3,631 | 8.2% | |||||
| 220 | Pleasant Hills | 3,836.0 | 3,561 | 7.7% | |||||
| 221 | Golden Beach | 3,830.0 | 3,779 | 1.3% | |||||
| 222 | Boonsboro | 3,809.0 | 3,273 | 16.4% | |||||
| 223 | Brentwood | 3,777.0 | 3,037 | 24.4% | |||||
| 224 | Brookmont | 3,671.0 | 3,626 | 1.2% | |||||
| 225 | Konterra | 3,641.0 | 2,168 | 67.9% | |||||
| 226 | Maugansville | 3,624.0 | 3,059 | 18.5% | |||||
| 227 | Drum Point | 3,589.0 | 3,324 | 8.0% | |||||
| 228 | Princess Anne | 3,569.0 | 3,140 | 13.7% | |||||
| 229 | Monrovia | 3,568.0 | 460 | 675.7% | |||||
| 230 | Grasonville | 3,564.0 | 3,114 | 14.5% | |||||
| 231 | Melwood | 3,401.0 | 2,852 | 19.2% | |||||
| 232 | Berwyn Heights | 3,318.0 | 3,102 | 7.0% | |||||
| 233 | Jefferson | 3,314.0 | 1,869 | 77.3% | |||||
| 234 | Bartonsville | 3,282.0 | 1,298 | 152.9% | |||||
| 235 | Andrews Afb | 3,130.0 | 2,719 | 15.1% | |||||
| 236 | Smithsburg | 3,115.0 | 2,861 | 8.9% | |||||
| 237 | Naval Academy | 3,006.0 | 4,168 | -27.9% | |||||
| 238 | Prince Frederick | 2,955.0 | 2,601 | 13.6% | |||||
| 239 | Braddock Heights | 2,892.0 | 2,709 | 6.8% | |||||
| 240 | Emmitsburg | 2,845.0 | 2,749 | 3.5% | |||||
| 241 | Federalsburg | 2,837.0 | 2,755 | 3.0% | |||||
| 242 | Gambrills | 2,830.0 | 2,575 | 9.9% | |||||
| 243 | Hurlock | 2,819.0 | 1,989 | 41.7% | |||||
| 244 | Rising Sun | 2,764.0 | 2,651 | 4.3% | |||||
| 245 | University Park | 2,698.0 | 2,528 | 6.7% | |||||
| 246 | Huntingtown | 2,689.0 | 3,022 | -11.0% | |||||
| 247 | Snow Hill | 2,659.0 | 2,520 | 5.5% | |||||
| 248 | Owings | 2,643.0 | 2,242 | 17.9% | |||||
| 249 | Forest Heights | 2,642.0 | 2,152 | 22.8% | |||||
| 250 | Greensboro | 2,634.0 | 2,455 | 7.3% | |||||
| 251 | Lusby | 2,595.0 | 2,325 | 11.6% | |||||
| 252 | Paramount-Long Meadow | 2,569.0 | 2,648 | -3.0% | |||||
| 253 | Jarrettsville | 2,560.0 | 3,152 | -18.8% | |||||
| 254 | Crisfield | 2,499.0 | 2,756 | -9.3% | |||||
| 255 | Point Of Rocks | 2,462.0 | 1,347 | 82.8% | |||||
| 256 | Solomons | 2,440.0 | 2,009 | 21.5% | |||||
| 257 | Herald Harbor | 2,430.0 | 2,244 | 8.3% | |||||
| 258 | Croom | 2,418.0 | 2,296 | 5.3% | |||||
| 259 | Kensington | 2,369.0 | 1,858 | 27.5% | |||||
| 260 | Myersville | 2,358.0 | 1,820 | 29.6% | |||||
| 261 | Baden | 2,325.0 | 2,269 | 2.5% | |||||
| 262 | North Beach | 2,296.0 | 1,606 | 43.0% | |||||
| 263 | Oakland | 2,254.0 | 1,881 | 19.8% | |||||
| 264 | Aberdeen Proving Ground | 2,193.0 | 3,558 | -38.4% | |||||
| 265 | Cabin John | 2,179.0 | 1,963 | 11.0% | |||||
| 266 | Perryman | 2,174.0 | 2,343 | -7.2% | |||||
| 267 | Mountain Lake Park | 2,167.0 | 1,860 | 16.5% | |||||
| 268 | Dunkirk | 2,166.0 | 2,603 | -16.8% | |||||
| 269 | Hughesville | 2,098.0 | 1,739 | 20.6% | |||||
| 270 | Landover Hills | 2,031.0 | 1,876 | 8.3% | |||||
| 271 | Adamstown | 2,025.0 | 2,134 | -5.1% | |||||
| 272 | Charle | 1,999.0 | 1,119 | 78.6% | |||||
| 273 | Derwood | 1,984.0 | 2,136 | -7.1% | |||||
| 274 | Pittsville | 1,950.0 | 1,494 | 30.5% | |||||
| 275 | Williamsport | 1,949.0 | 2,455 | -20.6% | |||||
| 276 | Chevy Chase Village | 1,903.0 | 2,010 | -5.3% | |||||
| 277 | Long Beach | 1,849.0 | 1,866 | -0.9% | |||||
| 278 | Ridgely | 1,772.0 | 2,257 | -21.5% | |||||
| 279 | Arden On The Severn | 1,761.0 | 1,921 | -8.3% | |||||
| 280 | Crownsville | 1,756.0 | 1,926 | -8.8% | |||||
| 281 | Kingstown | 1,713.0 | 1,811 | -5.4% | |||||
| 282 | Wilson-Conococheague | 1,663.0 | 2,256 | -26.3% | |||||
| 283 | Hancock | 1,625.0 | 1,334 | 21.8% | |||||
| 284 | New Market | 1,603.0 | 555 | 188.8% | |||||
| 285 | Westernport | 1,588.0 | 2,093 | -24.1% | |||||
| 286 | Hebron | 1,566.0 | 871 | 79.8% | |||||
| 287 | Colmar Manor | 1,566.0 | 1,383 | 13.2% | |||||
| 288 | Woodsboro | 1,540.0 | 1,101 | 39.9% | |||||
| 289 | Queen Anne | 1,443.0 | 1,132 | 27.5% | |||||
| 290 | Fairmount Heights | 1,416.0 | 1,292 | 9.6% | |||||
| 291 | New Windsor | 1,400.0 | 1,398 | 0.1% | |||||
| 292 | Mechanicsville | 1,395.0 | 1,528 | -8.7% | |||||
| 293 | Potomac Heights | 1,351.0 | 1,268 | 6.5% | |||||
| 294 | Libertytown | 1,346.0 | 745 | 80.7% | |||||
| 295 | Edmonston | 1,307.0 | 1,328 | -1.6% | |||||
| 296 | Willards | 1,280.0 | 1,077 | 18.8% | |||||
| 297 | Piney Point | 1,274.0 | 913 | 39.5% | |||||
| 298 | St. Michaels | 1,240.0 | 1,093 | 13.4% | |||||
| 299 | Rock Hall | 1,215.0 | 1,243 | -2.3% | |||||
| 300 | Buckeystown | 1,192.0 | 1,361 | -12.4% | |||||
| 301 | Keedysville | 1,183.0 | 1,169 | 1.2% | |||||
| 302 | Charlotte Hall | 1,172.0 | 1,384 | -15.3% | |||||
| 303 | Cottage City | 1,158.0 | 1,106 | 4.7% | |||||
| 304 | Bowmans Addition | 1,102.0 | 515 | 114.0% | |||||
| 305 | Highfield-Cascade | 1,089.0 | 860 | 26.6% | |||||
| 306 | Somerset | 1,088.0 | 1,367 | -20.4% | |||||
| 307 | Funk | 1,076.0 | 1,372 | -21.6% | |||||
| 308 | Algonquin | 1,074.0 | 1,130 | -5.0% | |||||
| 309 | Calvert Beach | 1,074.0 | 599 | 79.3% | |||||
| 310 | Mount Vernon | 1,067.0 | 799 | 33.5% | |||||
| 311 | Chevy Chase View | 1,063.0 | 1,010 | 5.2% | |||||
| 312 | Galesville | 1,062.0 | 498 | 113.3% | |||||
| 313 | Church Hill | 1,060.0 | 551 | 92.4% | |||||
| 314 | Trappe | 1,055.0 | 1,182 | -10.7% | |||||
| 315 | Union Bridge | 1,055.0 | 836 | 26.2% | |||||
| 316 | Eden | 1,053.0 | 839 | 25.5% | |||||
| 317 | Spencerville | 1,028.0 | 1,494 | -31.2% | |||||
| 318 | Grantsville | 1,013.0 | 719 | 40.9% | |||||
| 319 | Martin's Additions | 1,012.0 | 904 | 11.9% | |||||