College Park SnackAbility
Overall SnackAbility
Cost of living in College Park summary. We use data on the cost of living to determine how expensive it is to live in College Park. Real estate prices drive most of the variance in cost of living around Maryland. Key points include:
The cost of living in College Park is 127 with 100 being average.
The cost of living in College Park is 1.3x higher than the national average.
The median home value in College Park is $437,694.
The median income in College Park is $69,721.
College Park's Overall Cost Of Living
Higher Than The National Average
Cost Of Living In College Park Comparison Table
| Living Expense | College Park | Maryland | National Average |
|---|---|---|---|
| Overall | 127 | 121 | 100 |
| Services | 106 | 104 | 100 |
| Groceries | 108 | 107 | 100 |
| Health | 182 | 152 | 100 |
| Housing | 110 | 109 | 100 |
| Transportation | 106 | 108 | 100 |
| Utilities | 104 | 109 | 100 |
Source: Cost of living index, normalized to US average = 100
College Park, MD Weather
The average high in College Park is 66.1° and the average low is 45.4°.
There are 74.3 days of precipitation each year.
Expect an average of 42.8 inches of precipitation each year with 13.2 inches of snow.
| Stat | College Park |
|---|---|
| Average Annual High | 66.1 |
| Average Annual Low | 45.4 |
| Annual Precipitation Days | 74.3 |
| Average Annual Precipitation | 42.8 |
| Average Annual Snowfall | 13.2 |
Average High
Days of Rain
Source: NOAA climate normals (30-year)
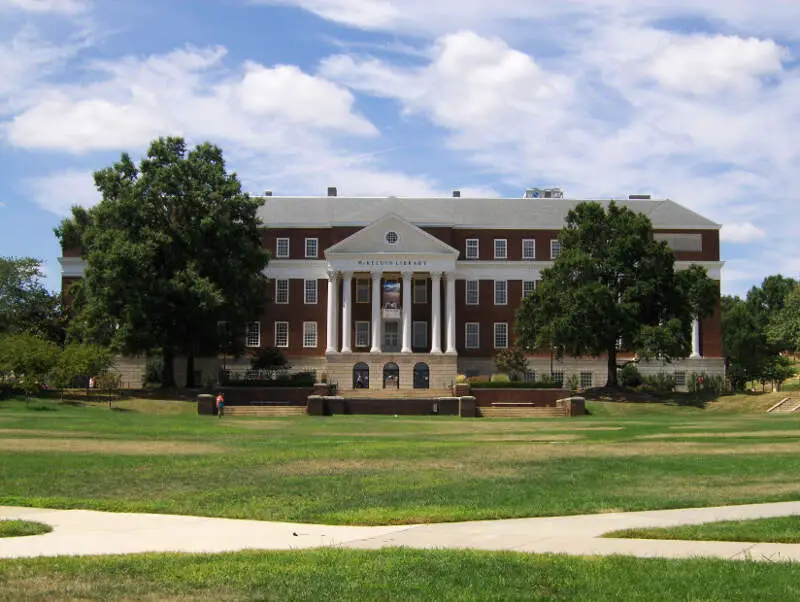
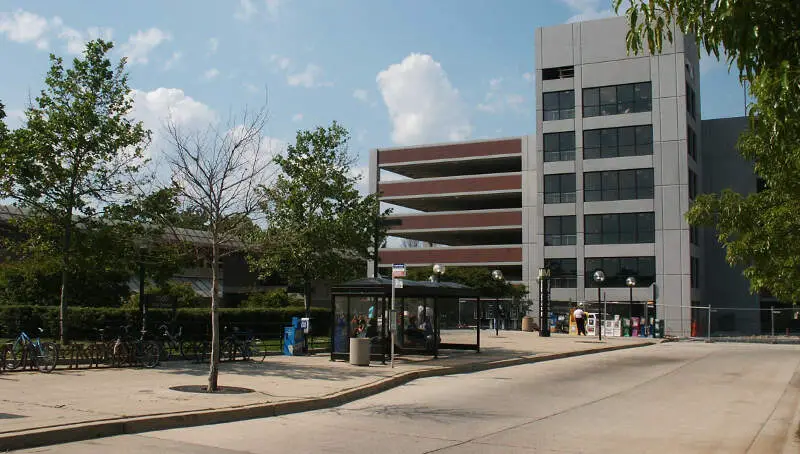
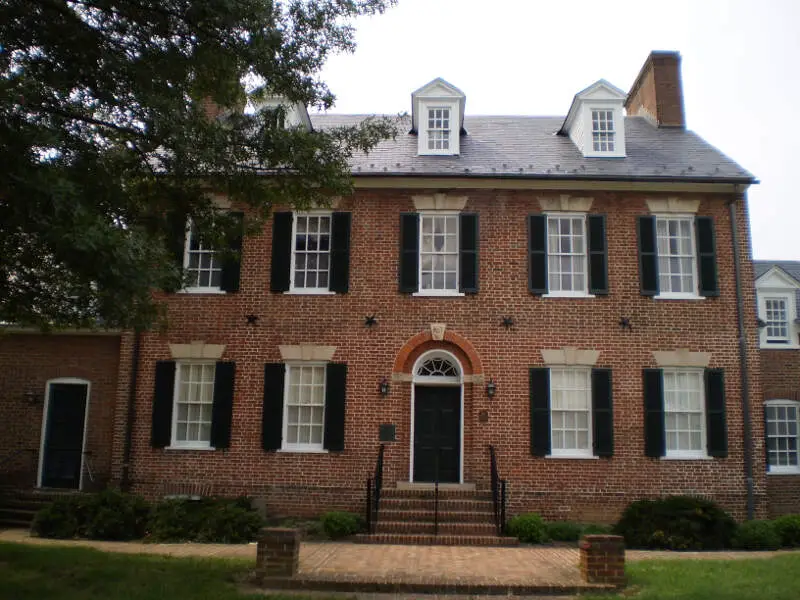
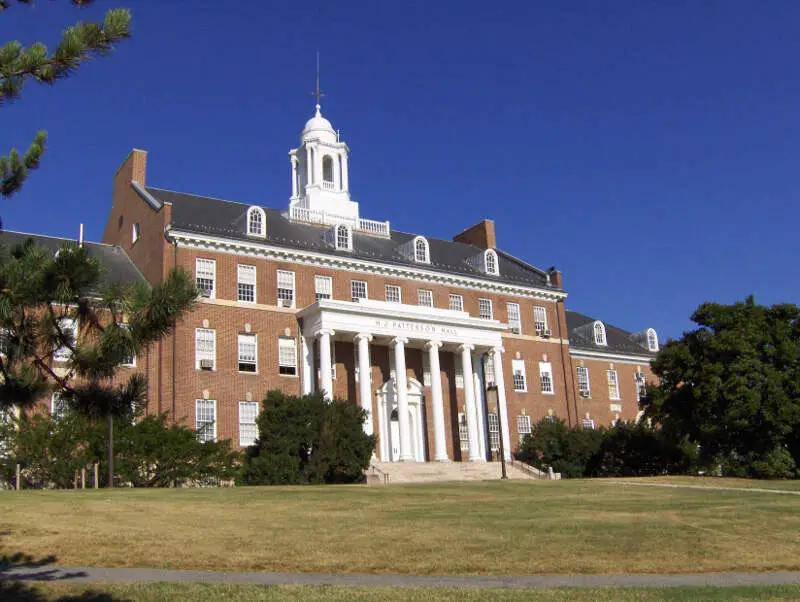
College Park, MD Photos


Rankings & Articles For College Park


Locations Around College Park
Map Of College Park, MD
Best Places Around College Park
Four Corners, MD
Population 8,150
North Potomac, MD
Population 23,922
Layhill, MD
Population 5,497
South Kensington, MD
Population 8,148
Ilchester, MD
Population 28,364
North Laurel, MD
Population 25,563
Colesville, MD
Population 14,519
Olney, MD
Population 35,797
Kemp Mill, MD
Population 13,042
College Park Demographics And Statistics
Population over time in College Park
The current population in College Park is 34,540. The population has increased 16.7% from 2010.
| Year | Population | % Change |
|---|---|---|
| 2024 | 34,540 | 0.4% |
| 2023 | 34,397 | -0.1% |
| 2022 | 34,416 | -1.6% |
| 2021 | 34,961 | 8.5% |
| 2020 | 32,221 | 0.2% |
| 2019 | 32,159 | -0.1% |
| 2018 | 32,183 | -0.0% |
| 2017 | 32,186 | 0.8% |
| 2016 | 31,942 | 0.7% |
| 2015 | 31,730 | 1.1% |
| 2014 | 31,387 | 2.0% |
| 2013 | 30,784 | 1.0% |
| 2012 | 30,478 | 1.6% |
| 2011 | 29,986 | 1.3% |
| 2010 | 29,596 | - |
Race / Ethnicity in College Park
See the full breakdown
College Park is:
37.2% White with 12,862 White residents.
23.6% African American with 8,151 African American residents.
0.1% American Indian with 44 American Indian residents.
15.8% Asian with 5,460 Asian residents.
0.0% Hawaiian with 8 Hawaiian residents.
0.5% Other with 164 Other residents.
5.0% Two Or More with 1,741 Two Or More residents.
17.7% Hispanic with 6,110 Hispanic residents.
| Race | College Park | MD | USA |
|---|---|---|---|
| White | 37.2% | 46.6% | 57.4% |
| African American | 23.6% | 28.9% | 11.9% |
| American Indian | 0.1% | 0.1% | 0.5% |
| Asian | 15.8% | 6.5% | 5.9% |
| Hawaiian | 0.0% | 0.0% | 0.2% |
| Other | 0.5% | 0.7% | 0.6% |
| Two Or More | 5.0% | 4.6% | 4.3% |
| Hispanic | 17.7% | 12.5% | 19.3% |
Gender in College Park
See the full breakdown
College Park is 49.1% female with 16,965 female residents.
College Park is 50.9% male with 17,575 male residents.
| Gender | College Park | MD | USA |
|---|---|---|---|
| Female | 49.1% | 51.3% | 50.5% |
| Male | 50.9% | 48.7% | 49.5% |
Highest level of educational attainment in College Park for adults over 25
See the full breakdown
10.0% of adults in College Park completed < 9th grade.
4.0% of adults in College Park completed 9-12th grade.
17.0% of adults in College Park completed high school / ged.
12.0% of adults in College Park completed some college.
5.0% of adults in College Park completed associate's degree.
28.0% of adults in College Park completed bachelor's degree.
17.0% of adults in College Park completed master's degree.
2.0% of adults in College Park completed professional degree.
5.0% of adults in College Park completed doctorate degree.
| Education | College Park | MD | USA |
|---|---|---|---|
| < 9th Grade | 10.0% | 4.0% | 4.0% |
| 9-12th Grade | 4.0% | 5.0% | 6.0% |
| High School / GED | 17.0% | 23.0% | 26.0% |
| Some College | 12.0% | 17.0% | 19.0% |
| Associate's Degree | 5.0% | 7.0% | 9.0% |
| Bachelor's Degree | 28.0% | 23.0% | 22.0% |
| Master's Degree | 17.0% | 15.0% | 10.0% |
| Professional Degree | 2.0% | 3.0% | 2.0% |
| Doctorate Degree | 5.0% | 3.0% | 2.0% |
Household Income For College Park, Maryland
See the full breakdown
16.2% of households in College Park earn Less than $10,000.
2.5% of households in College Park earn $10,000 to $14,999.
8.7% of households in College Park earn $15,000 to $24,999.
8.3% of households in College Park earn $25,000 to $34,999.
5.6% of households in College Park earn $35,000 to $49,999.
10.0% of households in College Park earn $50,000 to $74,999.
8.4% of households in College Park earn $75,000 to $99,999.
15.0% of households in College Park earn $100,000 to $149,999.
13.1% of households in College Park earn $150,000 to $199,999.
12.0% of households in College Park earn $200,000 or more.
| Income | College Park | MD | USA |
|---|---|---|---|
| Less than $10,000 | 16.2% | 4.4% | 5.0% |
| $10,000 to $14,999 | 2.5% | 2.4% | 3.4% |
| $15,000 to $24,999 | 8.7% | 4.3% | 6.3% |
| $25,000 to $34,999 | 8.3% | 4.9% | 6.6% |
| $35,000 to $49,999 | 5.6% | 7.5% | 10.1% |
| $50,000 to $74,999 | 10.0% | 12.8% | 15.5% |
| $75,000 to $99,999 | 8.4% | 11.9% | 12.6% |
| $100,000 to $149,999 | 15.0% | 18.9% | 17.5% |
| $150,000 to $199,999 | 13.1% | 12.5% | 9.6% |
| $200,000 or more | 12.0% | 20.3% | 13.4% |
Source: U.S. Census ACS 5-year estimates (2024)


