Dundalk SnackAbility
Overall SnackAbility
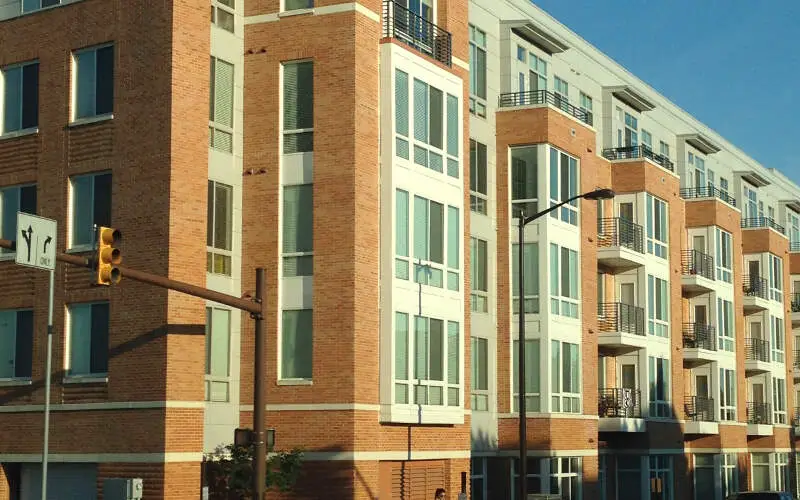
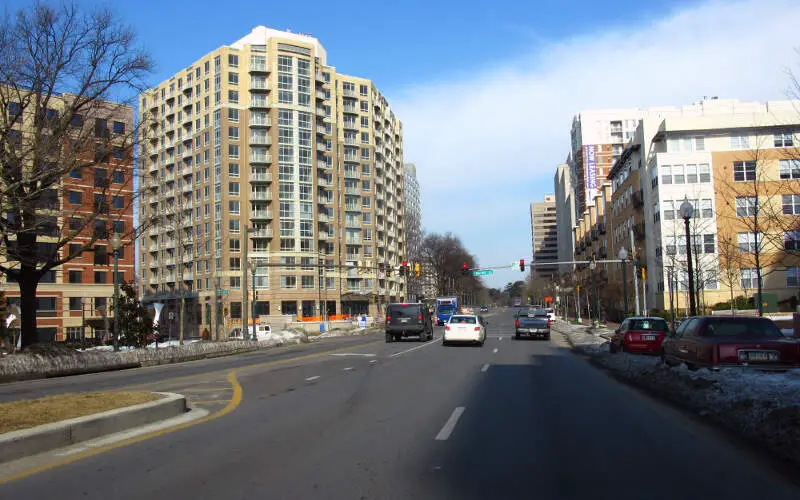
Cost of living in Dundalk summary. We use data on the cost of living to determine how expensive it is to live in Dundalk. Real estate prices drive most of the variance in cost of living around Maryland. Key points include:
The cost of living in Dundalk is 106 with 100 being average.
The cost of living in Dundalk is 1.1x higher than the national average.
The median home value in Dundalk is $222,673.
The median income in Dundalk is $64,520.
Dundalk's Overall Cost Of Living
Higher Than The National Average
Cost Of Living In Dundalk Comparison Table
| Living Expense | Dundalk | Maryland | National Average |
|---|---|---|---|
| Overall | 106 | 121 | 100 |
| Services | 104 | 104 | 100 |
| Groceries | 110 | 107 | 100 |
| Health | 100 | 152 | 100 |
| Housing | 111 | 109 | 100 |
| Transportation | 110 | 108 | 100 |
| Utilities | 113 | 109 | 100 |
Source: Cost of living index, normalized to US average = 100
Dundalk, MD Weather
The average high in Dundalk is 64.9° and the average low is 48.4°.
There are 68.4 days of precipitation each year.
Expect an average of 44.3 inches of precipitation each year with 16.6 inches of snow.
| Stat | Dundalk |
|---|---|
| Average Annual High | 64.9 |
| Average Annual Low | 48.4 |
| Annual Precipitation Days | 68.4 |
| Average Annual Precipitation | 44.3 |
| Average Annual Snowfall | 16.6 |
Average High
Days of Rain
Source: NOAA climate normals (30-year)
Dundalk, MD Photos

1 Reviews & Comments About Dundalk

I live in Dundalk there is no crime drugs maybe junkies but Dundalk is probably the best place to live in all of Maryland
Rankings & Articles For Dundalk


Locations Around Dundalk
Map Of Dundalk, MD
Best Places Around Dundalk
Ilchester, MD
Population 28,364
Columbia, MD
Population 104,338
Savage, MD
Population 8,239
Severna Park, MD
Population 40,228
Cape St. Claire, MD
Population 9,236
Elkridge, MD
Population 26,283
Fallston, MD
Population 10,013
Bel Air South, MD
Population 58,137
Arnold, MD
Population 24,303
Riviera Beach, MD
Population 12,192
Dundalk Demographics And Statistics
Population over time in Dundalk
The current population in Dundalk is 65,969. The population has increased 5.6% from 2010.
| Year | Population | % Change |
|---|---|---|
| 2024 | 65,969 | 0.8% |
| 2023 | 65,441 | -1.3% |
| 2022 | 66,321 | -0.2% |
| 2021 | 66,426 | 4.1% |
| 2020 | 63,826 | 1.3% |
| 2019 | 63,015 | 0.4% |
| 2018 | 62,768 | 0.4% |
| 2017 | 62,516 | 0.3% |
| 2016 | 62,337 | -0.0% |
| 2015 | 62,349 | 0.3% |
| 2014 | 62,186 | 0.4% |
| 2013 | 61,930 | -0.8% |
| 2012 | 62,459 | 1.0% |
| 2011 | 61,852 | -0.9% |
| 2010 | 62,444 | - |
Race / Ethnicity in Dundalk
See the full breakdown
Dundalk is:
61.7% White with 40,688 White residents.
16.2% African American with 10,705 African American residents.
0.4% American Indian with 239 American Indian residents.
2.0% Asian with 1,318 Asian residents.
0.0% Hawaiian with 8 Hawaiian residents.
0.6% Other with 427 Other residents.
5.2% Two Or More with 3,404 Two Or More residents.
13.9% Hispanic with 9,180 Hispanic residents.
| Race | Dundalk | MD | USA |
|---|---|---|---|
| White | 61.7% | 46.6% | 57.4% |
| African American | 16.2% | 28.9% | 11.9% |
| American Indian | 0.4% | 0.1% | 0.5% |
| Asian | 2.0% | 6.5% | 5.9% |
| Hawaiian | 0.0% | 0.0% | 0.2% |
| Other | 0.6% | 0.7% | 0.6% |
| Two Or More | 5.2% | 4.6% | 4.3% |
| Hispanic | 13.9% | 12.5% | 19.3% |
Gender in Dundalk
See the full breakdown
Dundalk is 51.3% female with 33,872 female residents.
Dundalk is 48.7% male with 32,096 male residents.
| Gender | Dundalk | MD | USA |
|---|---|---|---|
| Female | 51.3% | 51.3% | 50.5% |
| Male | 48.7% | 48.7% | 49.5% |
Highest level of educational attainment in Dundalk for adults over 25
See the full breakdown
6.0% of adults in Dundalk completed < 9th grade.
11.0% of adults in Dundalk completed 9-12th grade.
40.0% of adults in Dundalk completed high school / ged.
20.0% of adults in Dundalk completed some college.
7.0% of adults in Dundalk completed associate's degree.
10.0% of adults in Dundalk completed bachelor's degree.
4.0% of adults in Dundalk completed master's degree.
1.0% of adults in Dundalk completed professional degree.
1.0% of adults in Dundalk completed doctorate degree.
| Education | Dundalk | MD | USA |
|---|---|---|---|
| < 9th Grade | 6.0% | 4.0% | 4.0% |
| 9-12th Grade | 11.0% | 5.0% | 6.0% |
| High School / GED | 40.0% | 23.0% | 26.0% |
| Some College | 20.0% | 17.0% | 19.0% |
| Associate's Degree | 7.0% | 7.0% | 9.0% |
| Bachelor's Degree | 10.0% | 23.0% | 22.0% |
| Master's Degree | 4.0% | 15.0% | 10.0% |
| Professional Degree | 1.0% | 3.0% | 2.0% |
| Doctorate Degree | 1.0% | 3.0% | 2.0% |
Household Income For Dundalk, Maryland
See the full breakdown
6.0% of households in Dundalk earn Less than $10,000.
3.8% of households in Dundalk earn $10,000 to $14,999.
8.0% of households in Dundalk earn $15,000 to $24,999.
9.6% of households in Dundalk earn $25,000 to $34,999.
11.4% of households in Dundalk earn $35,000 to $49,999.
18.4% of households in Dundalk earn $50,000 to $74,999.
15.0% of households in Dundalk earn $75,000 to $99,999.
14.8% of households in Dundalk earn $100,000 to $149,999.
7.4% of households in Dundalk earn $150,000 to $199,999.
5.6% of households in Dundalk earn $200,000 or more.
| Income | Dundalk | MD | USA |
|---|---|---|---|
| Less than $10,000 | 6.0% | 4.4% | 5.0% |
| $10,000 to $14,999 | 3.8% | 2.4% | 3.4% |
| $15,000 to $24,999 | 8.0% | 4.3% | 6.3% |
| $25,000 to $34,999 | 9.6% | 4.9% | 6.6% |
| $35,000 to $49,999 | 11.4% | 7.5% | 10.1% |
| $50,000 to $74,999 | 18.4% | 12.8% | 15.5% |
| $75,000 to $99,999 | 15.0% | 11.9% | 12.6% |
| $100,000 to $149,999 | 14.8% | 18.9% | 17.5% |
| $150,000 to $199,999 | 7.4% | 12.5% | 9.6% |
| $200,000 or more | 5.6% | 20.3% | 13.4% |
Source: U.S. Census ACS 5-year estimates (2024)


