Hampstead SnackAbility
Overall SnackAbility
Crime in Hampstead summary. We use data from the FBI to determine the crime rates in Hampstead. Key points include:
There were 63 total crimes in Hampstead in the last reporting year.
The overall crime rate per 100,000 people in Hampstead is 977.5 / 100k people.
The violent crime rate per 100,000 people in Hampstead is 155.2 / 100k people.
The property crime rate per 100,000 people in Hampstead is 822.3 / 100k people.
Overall, crime in Hampstead is -53.87% below the national average.
Total Crimes
Below National Average
Crime In Hampstead Comparison Table
| Statistic | Count Raw |
Hampstead / 100k People |
Maryland / 100k People |
National / 100k People |
|---|---|---|---|---|
| Total Crimes Per 100K | 63 | 977.5 | 2,470.0 | 2,119.2 |
| Violent Crime | 10 | 155.2 | 420.4 | 359.0 |
| Murder | 0 | 0.0 | 7.2 | 5.0 |
| Robbery | 1 | 15.5 | 123.2 | 61.0 |
| Aggravated Assault | 9 | 139.6 | 257.0 | 256.0 |
| Property Crime | 53 | 822.3 | 2,049.6 | 1,760.0 |
| Burglary | 5 | 77.6 | 190.0 | 229.0 |
| Larceny | 45 | 698.2 | 1,446.8 | 1,272.0 |
| Car Theft | 3 | 46.5 | 412.8 | 259.0 |
Source: FBI Uniform Crime Reporting (2024)
Cost of living in Hampstead summary. We use data on the cost of living to determine how expensive it is to live in Hampstead. Real estate prices drive most of the variance in cost of living around Maryland. Key points include:
The cost of living in Hampstead is 112 with 100 being average.
The cost of living in Hampstead is 1.1x higher than the national average.
The median home value in Hampstead is $439,359.
The median income in Hampstead is $97,871.
Hampstead's Overall Cost Of Living
Higher Than The National Average
Cost Of Living In Hampstead Comparison Table
| Living Expense | Hampstead | Maryland | National Average |
|---|---|---|---|
| Overall | 112 | 121 | 100 |
| Services | 108 | 104 | 100 |
| Groceries | 108 | 107 | 100 |
| Health | 121 | 152 | 100 |
| Housing | 110 | 109 | 100 |
| Transportation | 107 | 108 | 100 |
| Utilities | 106 | 109 | 100 |
Source: Cost of living index, normalized to US average = 100
Hampstead, MD Weather
The average high in Hampstead is 63.1° and the average low is 43.5°.
There are 72.3 days of precipitation each year.
Expect an average of 44.9 inches of precipitation each year with 27.0 inches of snow.
| Stat | Hampstead |
|---|---|
| Average Annual High | 63.1 |
| Average Annual Low | 43.5 |
| Annual Precipitation Days | 72.3 |
| Average Annual Precipitation | 44.9 |
| Average Annual Snowfall | 27.0 |
Average High
Days of Rain
Source: NOAA climate normals (30-year)
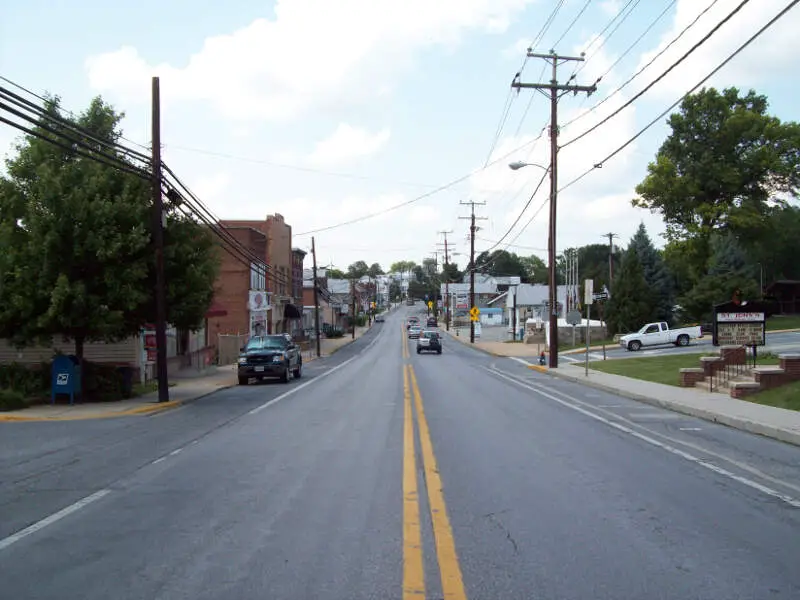
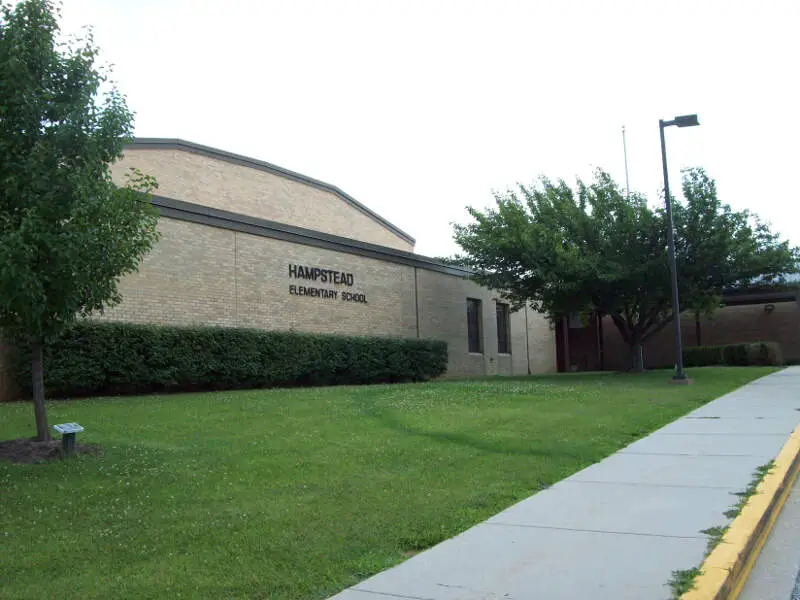
Hampstead, MD Photos
Rankings & Articles For Hampstead


Locations Around Hampstead
Map Of Hampstead, MD
Best Places Around Hampstead
Eldersburg, MD
Population 31,695
Mays Chapel, MD
Population 16,066
Parkville, PA
Population 8,128
Hanover, PA
Population 16,584
Lutherville, MD
Population 6,574
Timonium, MD
Population 10,304
Taneytown, MD
Population 7,932
Towson, MD
Population 58,679
Randallstown, MD
Population 35,957
Pikesville, MD
Population 33,524
Hampstead Demographics And Statistics
Population over time in Hampstead
The current population in Hampstead is 6,251. The population has increased 0.8% from 2010.
| Year | Population | % Change |
|---|---|---|
| 2024 | 6,251 | -1.0% |
| 2023 | 6,311 | 0.5% |
| 2022 | 6,278 | 0.1% |
| 2021 | 6,273 | -2.0% |
| 2020 | 6,403 | 0.6% |
| 2019 | 6,362 | 0.3% |
| 2018 | 6,340 | 0.1% |
| 2017 | 6,331 | -0.3% |
| 2016 | 6,352 | 0.0% |
| 2015 | 6,351 | 0.1% |
| 2014 | 6,342 | 0.2% |
| 2013 | 6,328 | 0.5% |
| 2012 | 6,299 | 0.5% |
| 2011 | 6,266 | 1.0% |
| 2010 | 6,203 | - |
Race / Ethnicity in Hampstead
See the full breakdown
Hampstead is:
86.9% White with 5,434 White residents.
3.3% African American with 205 African American residents.
0.0% American Indian with 0 American Indian residents.
4.1% Asian with 254 Asian residents.
0.0% Hawaiian with 0 Hawaiian residents.
1.3% Other with 80 Other residents.
3.1% Two Or More with 191 Two Or More residents.
1.4% Hispanic with 87 Hispanic residents.
| Race | Hampstead | MD | USA |
|---|---|---|---|
| White | 86.9% | 46.6% | 57.4% |
| African American | 3.3% | 28.9% | 11.9% |
| American Indian | 0.0% | 0.1% | 0.5% |
| Asian | 4.1% | 6.5% | 5.9% |
| Hawaiian | 0.0% | 0.0% | 0.2% |
| Other | 1.3% | 0.7% | 0.6% |
| Two Or More | 3.1% | 4.6% | 4.3% |
| Hispanic | 1.4% | 12.5% | 19.3% |
Gender in Hampstead
See the full breakdown
Hampstead is 52.2% female with 3,263 female residents.
Hampstead is 47.8% male with 2,987 male residents.
| Gender | Hampstead | MD | USA |
|---|---|---|---|
| Female | 52.2% | 51.3% | 50.5% |
| Male | 47.8% | 48.7% | 49.5% |
Highest level of educational attainment in Hampstead for adults over 25
See the full breakdown
-0.0% of adults in Hampstead completed < 9th grade.
2.0% of adults in Hampstead completed 9-12th grade.
23.0% of adults in Hampstead completed high school / ged.
22.0% of adults in Hampstead completed some college.
13.0% of adults in Hampstead completed associate's degree.
27.0% of adults in Hampstead completed bachelor's degree.
8.0% of adults in Hampstead completed master's degree.
2.0% of adults in Hampstead completed professional degree.
3.0% of adults in Hampstead completed doctorate degree.
| Education | Hampstead | MD | USA |
|---|---|---|---|
| < 9th Grade | -0.0% | 4.0% | 4.0% |
| 9-12th Grade | 2.0% | 5.0% | 6.0% |
| High School / GED | 23.0% | 23.0% | 26.0% |
| Some College | 22.0% | 17.0% | 19.0% |
| Associate's Degree | 13.0% | 7.0% | 9.0% |
| Bachelor's Degree | 27.0% | 23.0% | 22.0% |
| Master's Degree | 8.0% | 15.0% | 10.0% |
| Professional Degree | 2.0% | 3.0% | 2.0% |
| Doctorate Degree | 3.0% | 3.0% | 2.0% |
Household Income For Hampstead, Maryland
See the full breakdown
1.4% of households in Hampstead earn Less than $10,000.
0.7% of households in Hampstead earn $10,000 to $14,999.
7.1% of households in Hampstead earn $15,000 to $24,999.
5.2% of households in Hampstead earn $25,000 to $34,999.
12.2% of households in Hampstead earn $35,000 to $49,999.
13.3% of households in Hampstead earn $50,000 to $74,999.
12.2% of households in Hampstead earn $75,000 to $99,999.
18.6% of households in Hampstead earn $100,000 to $149,999.
19.0% of households in Hampstead earn $150,000 to $199,999.
10.4% of households in Hampstead earn $200,000 or more.
| Income | Hampstead | MD | USA |
|---|---|---|---|
| Less than $10,000 | 1.4% | 4.4% | 5.0% |
| $10,000 to $14,999 | 0.7% | 2.4% | 3.4% |
| $15,000 to $24,999 | 7.1% | 4.3% | 6.3% |
| $25,000 to $34,999 | 5.2% | 4.9% | 6.6% |
| $35,000 to $49,999 | 12.2% | 7.5% | 10.1% |
| $50,000 to $74,999 | 13.3% | 12.8% | 15.5% |
| $75,000 to $99,999 | 12.2% | 11.9% | 12.6% |
| $100,000 to $149,999 | 18.6% | 18.9% | 17.5% |
| $150,000 to $199,999 | 19.0% | 12.5% | 9.6% |
| $200,000 or more | 10.4% | 20.3% | 13.4% |
Source: U.S. Census ACS 5-year estimates (2024)


