Ocean City SnackAbility
Overall SnackAbility
Crime in Ocean City summary. We use data from the FBI to determine the crime rates in Ocean City. Key points include:
There were 679 total crimes in Ocean City in the last reporting year.
The overall crime rate per 100,000 people in Ocean City is 9,786.7 / 100k people.
The violent crime rate per 100,000 people in Ocean City is 980.1 / 100k people.
The property crime rate per 100,000 people in Ocean City is 8,806.6 / 100k people.
Overall, crime in Ocean City is 361.80% above the national average.
Total Crimes
Above National Average
Crime In Ocean City Comparison Table
| Statistic | Count Raw |
Ocean City / 100k People |
Maryland / 100k People |
National / 100k People |
|---|---|---|---|---|
| Total Crimes Per 100K | 679 | 9,786.7 | 2,470.0 | 2,119.2 |
| Violent Crime | 68 | 980.1 | 420.4 | 359.0 |
| Murder | 0 | 0.0 | 7.2 | 5.0 |
| Robbery | 4 | 57.7 | 123.2 | 61.0 |
| Aggravated Assault | 52 | 749.5 | 257.0 | 256.0 |
| Property Crime | 611 | 8,806.6 | 2,049.6 | 1,760.0 |
| Burglary | 63 | 908.0 | 190.0 | 229.0 |
| Larceny | 521 | 7,509.4 | 1,446.8 | 1,272.0 |
| Car Theft | 27 | 389.2 | 412.8 | 259.0 |
Source: FBI Uniform Crime Reporting (2024)
Cost of living in Ocean City summary. We use data on the cost of living to determine how expensive it is to live in Ocean City. Real estate prices drive most of the variance in cost of living around Maryland. Key points include:
The cost of living in Ocean City is 120 with 100 being average.
The cost of living in Ocean City is 1.2x higher than the national average.
The median home value in Ocean City is $441,288.
The median income in Ocean City is $77,750.
Ocean City's Overall Cost Of Living
Higher Than The National Average
Cost Of Living In Ocean City Comparison Table
| Living Expense | Ocean City | Maryland | National Average |
|---|---|---|---|
| Overall | 120 | 121 | 100 |
| Services | 105 | 104 | 100 |
| Groceries | 109 | 107 | 100 |
| Health | 147 | 152 | 100 |
| Housing | 112 | 109 | 100 |
| Transportation | 108 | 108 | 100 |
| Utilities | 113 | 109 | 100 |
Source: Cost of living index, normalized to US average = 100
Ocean City, MD Weather
The average high in Ocean City is 65.0° and the average low is 48.8°.
There are 74.1 days of precipitation each year.
Expect an average of 39.0 inches of precipitation each year with 8.2 inches of snow.
| Stat | Ocean City |
|---|---|
| Average Annual High | 65.0 |
| Average Annual Low | 48.8 |
| Annual Precipitation Days | 74.1 |
| Average Annual Precipitation | 39.0 |
| Average Annual Snowfall | 8.2 |
Average High
Days of Rain
Source: NOAA climate normals (30-year)
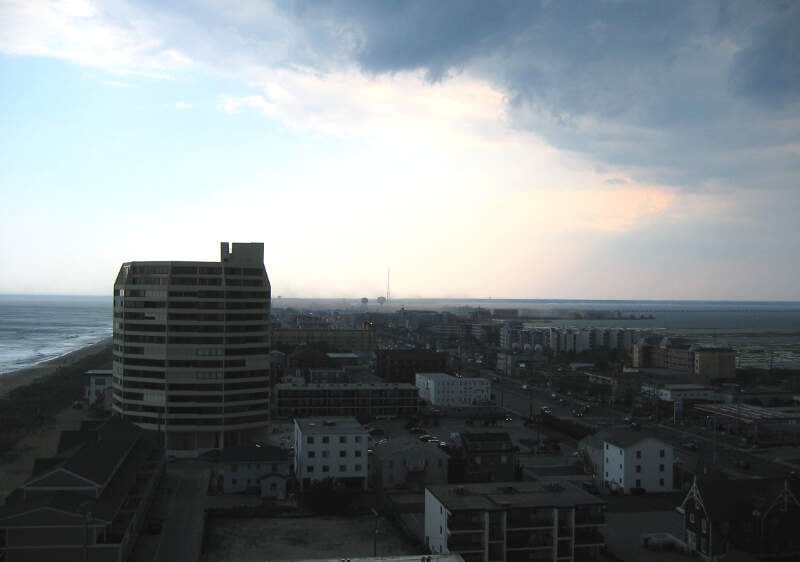
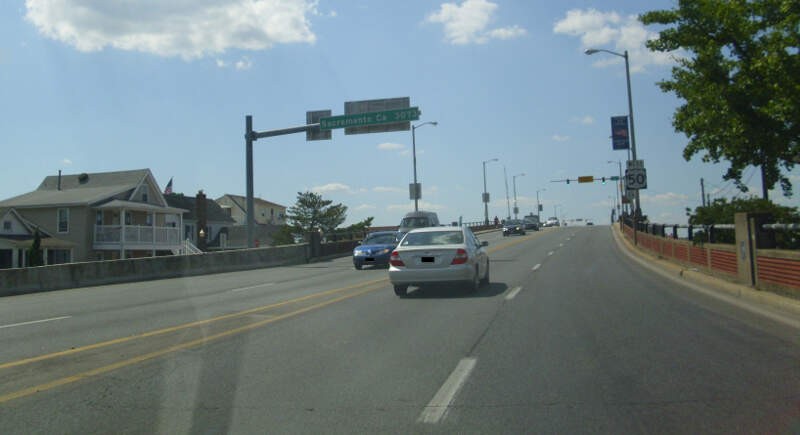
Ocean City, MD Photos


1 Reviews & Comments About Ocean City

This is a beach on the east coast that in my opinion has the best boardwalk! there are many types of foods something for everyone! I love Dumsers Hommade Ice cream and Thrashers French fries the best breakfast is A made while you wait donor at Fracured Prune. They are all types of games and rides for all ages the street entertainers are fun to watch. the hotel were we stay is right on the boardwalk it is the plum plaza with a fabulous porch to sit on and watch the people the ocean and people on the beach>
There is not much I can say bad about ocean city the only thing that could be bad is the water is unpredictable so one needs to take clothes that are for cold and warm/hot weather
Rankings & Articles For Ocean City


Locations Around Ocean City
Map Of Ocean City, MD
Best Places Around Ocean City
Ocean City Demographics And Statistics
Population over time in Ocean City
The current population in Ocean City is 6,903. The population has decreased 4.0% from 2010.
| Year | Population | % Change |
|---|---|---|
| 2024 | 6,903 | 0.2% |
| 2023 | 6,887 | 0.1% |
| 2022 | 6,879 | 0.1% |
| 2021 | 6,869 | -1.3% |
| 2020 | 6,957 | -0.2% |
| 2019 | 6,972 | -0.3% |
| 2018 | 6,990 | -0.5% |
| 2017 | 7,026 | -0.2% |
| 2016 | 7,041 | -0.5% |
| 2015 | 7,074 | -0.3% |
| 2014 | 7,093 | -0.2% |
| 2013 | 7,108 | -0.4% |
| 2012 | 7,134 | -0.4% |
| 2011 | 7,161 | -0.5% |
| 2010 | 7,194 | - |
Race / Ethnicity in Ocean City
See the full breakdown
Ocean City is:
84.0% White with 5,799 White residents.
1.6% African American with 107 African American residents.
0.1% American Indian with 9 American Indian residents.
1.7% Asian with 120 Asian residents.
0.4% Hawaiian with 29 Hawaiian residents.
1.8% Other with 123 Other residents.
0.9% Two Or More with 59 Two Or More residents.
9.5% Hispanic with 657 Hispanic residents.
| Race | Ocean City | MD | USA |
|---|---|---|---|
| White | 84.0% | 46.6% | 57.4% |
| African American | 1.6% | 28.9% | 11.9% |
| American Indian | 0.1% | 0.1% | 0.5% |
| Asian | 1.7% | 6.5% | 5.9% |
| Hawaiian | 0.4% | 0.0% | 0.2% |
| Other | 1.8% | 0.7% | 0.6% |
| Two Or More | 0.9% | 4.6% | 4.3% |
| Hispanic | 9.5% | 12.5% | 19.3% |
Gender in Ocean City
See the full breakdown
Ocean City is 51.3% female with 3,541 female residents.
Ocean City is 48.7% male with 3,361 male residents.
| Gender | Ocean City | MD | USA |
|---|---|---|---|
| Female | 51.3% | 51.3% | 50.5% |
| Male | 48.7% | 48.7% | 49.5% |
Highest level of educational attainment in Ocean City for adults over 25
See the full breakdown
2.0% of adults in Ocean City completed < 9th grade.
4.0% of adults in Ocean City completed 9-12th grade.
24.0% of adults in Ocean City completed high school / ged.
21.0% of adults in Ocean City completed some college.
8.0% of adults in Ocean City completed associate's degree.
25.0% of adults in Ocean City completed bachelor's degree.
13.0% of adults in Ocean City completed master's degree.
2.0% of adults in Ocean City completed professional degree.
1.0% of adults in Ocean City completed doctorate degree.
| Education | Ocean City | MD | USA |
|---|---|---|---|
| < 9th Grade | 2.0% | 4.0% | 4.0% |
| 9-12th Grade | 4.0% | 5.0% | 6.0% |
| High School / GED | 24.0% | 23.0% | 26.0% |
| Some College | 21.0% | 17.0% | 19.0% |
| Associate's Degree | 8.0% | 7.0% | 9.0% |
| Bachelor's Degree | 25.0% | 23.0% | 22.0% |
| Master's Degree | 13.0% | 15.0% | 10.0% |
| Professional Degree | 2.0% | 3.0% | 2.0% |
| Doctorate Degree | 1.0% | 3.0% | 2.0% |
Household Income For Ocean City, Maryland
See the full breakdown
5.9% of households in Ocean City earn Less than $10,000.
0.6% of households in Ocean City earn $10,000 to $14,999.
5.7% of households in Ocean City earn $15,000 to $24,999.
6.8% of households in Ocean City earn $25,000 to $34,999.
10.3% of households in Ocean City earn $35,000 to $49,999.
16.8% of households in Ocean City earn $50,000 to $74,999.
17.1% of households in Ocean City earn $75,000 to $99,999.
15.1% of households in Ocean City earn $100,000 to $149,999.
8.3% of households in Ocean City earn $150,000 to $199,999.
13.2% of households in Ocean City earn $200,000 or more.
| Income | Ocean City | MD | USA |
|---|---|---|---|
| Less than $10,000 | 5.9% | 4.4% | 5.0% |
| $10,000 to $14,999 | 0.6% | 2.4% | 3.4% |
| $15,000 to $24,999 | 5.7% | 4.3% | 6.3% |
| $25,000 to $34,999 | 6.8% | 4.9% | 6.6% |
| $35,000 to $49,999 | 10.3% | 7.5% | 10.1% |
| $50,000 to $74,999 | 16.8% | 12.8% | 15.5% |
| $75,000 to $99,999 | 17.1% | 11.9% | 12.6% |
| $100,000 to $149,999 | 15.1% | 18.9% | 17.5% |
| $150,000 to $199,999 | 8.3% | 12.5% | 9.6% |
| $200,000 or more | 13.2% | 20.3% | 13.4% |
Source: U.S. Census ACS 5-year estimates (2024)


