Rockville SnackAbility
Overall SnackAbility
Cost of living in Rockville summary. We use data on the cost of living to determine how expensive it is to live in Rockville. Real estate prices drive most of the variance in cost of living around Maryland. Key points include:
The cost of living in Rockville is 157 with 100 being average.
The cost of living in Rockville is 1.6x higher than the national average.
The median home value in Rockville is $618,892.
The median income in Rockville is $128,649.
Rockville's Overall Cost Of Living
Higher Than The National Average
Cost Of Living In Rockville Comparison Table
| Living Expense | Rockville | Maryland | National Average |
|---|---|---|---|
| Overall | 157 | 121 | 100 |
| Services | 104 | 104 | 100 |
| Groceries | 106 | 107 | 100 |
| Health | 272 | 152 | 100 |
| Housing | 115 | 109 | 100 |
| Transportation | 106 | 108 | 100 |
| Utilities | 113 | 109 | 100 |
Source: Cost of living index, normalized to US average = 100
Rockville, MD Weather
The average high in Rockville is 65.2° and the average low is 45.1°.
There are 72.5 days of precipitation each year.
Expect an average of 41.9 inches of precipitation each year with 19.4 inches of snow.
| Stat | Rockville |
|---|---|
| Average Annual High | 65.2 |
| Average Annual Low | 45.1 |
| Annual Precipitation Days | 72.5 |
| Average Annual Precipitation | 41.9 |
| Average Annual Snowfall | 19.4 |
Average High
Days of Rain
Source: NOAA climate normals (30-year)
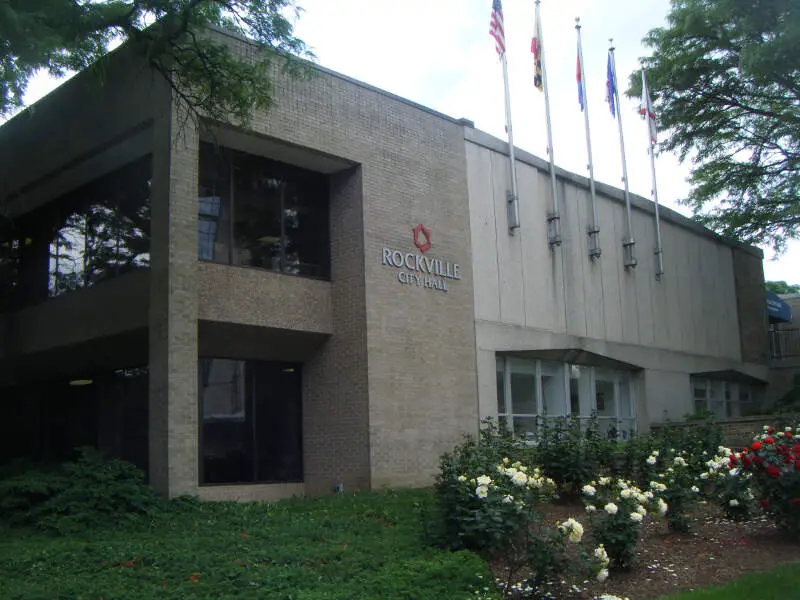
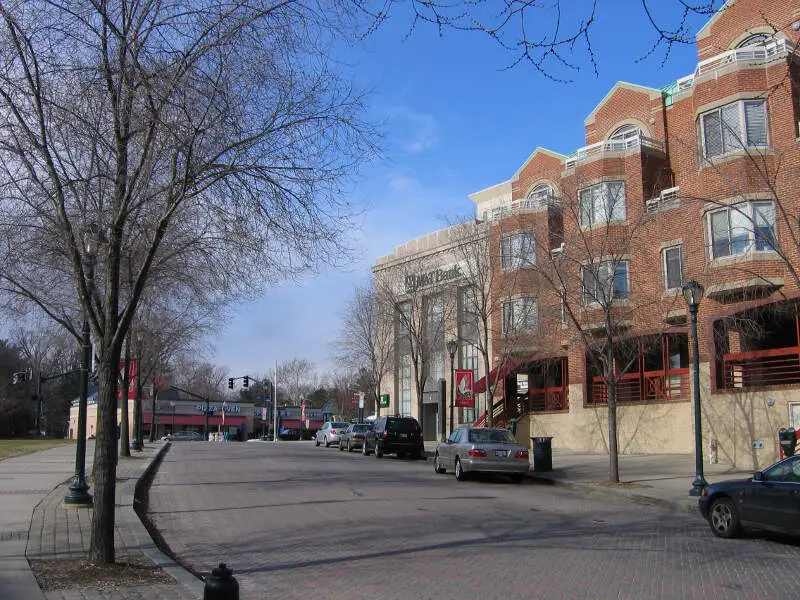
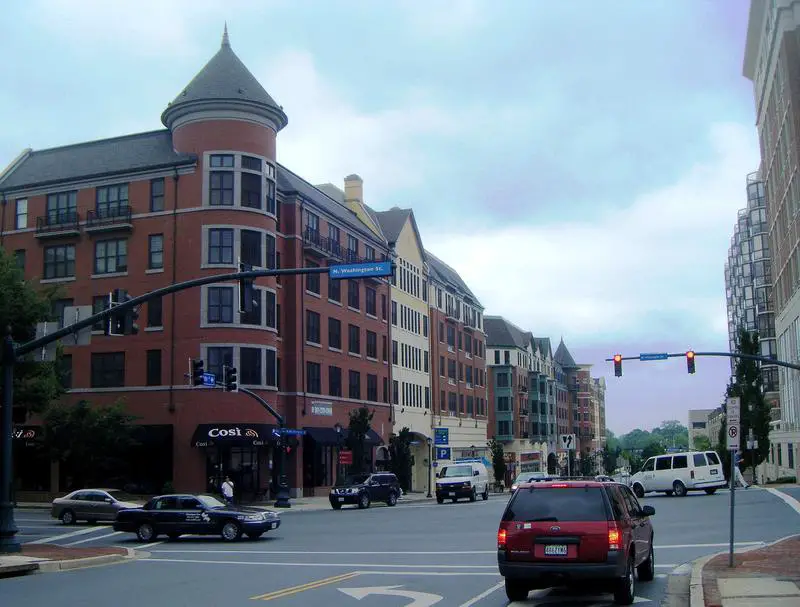
Rockville, MD Photos


Rankings & Articles For Rockville


Locations Around Rockville
Map Of Rockville, MD
Best Places Around Rockville
Four Corners, MD
Population 8,150
North Potomac, MD
Population 23,922
Layhill, MD
Population 5,497
South Kensington, MD
Population 8,148
North Laurel, MD
Population 25,563
Colesville, MD
Population 14,519
Olney, MD
Population 35,797
Kemp Mill, MD
Population 13,042
Clarksburg, MD
Population 30,487
Rockville Demographics And Statistics
Population over time in Rockville
The current population in Rockville is 67,671. The population has increased 16.1% from 2010.
| Year | Population | % Change |
|---|---|---|
| 2024 | 67,671 | 0.7% |
| 2023 | 67,218 | 0.1% |
| 2022 | 67,142 | 0.1% |
| 2021 | 67,095 | -1.6% |
| 2020 | 68,155 | 0.9% |
| 2019 | 67,542 | 0.7% |
| 2018 | 67,062 | 1.0% |
| 2017 | 66,420 | 1.9% |
| 2016 | 65,171 | 1.3% |
| 2015 | 64,331 | 1.5% |
| 2014 | 63,402 | 2.0% |
| 2013 | 62,130 | 1.9% |
| 2012 | 60,960 | 2.2% |
| 2011 | 59,653 | 2.3% |
| 2010 | 58,300 | - |
Race / Ethnicity in Rockville
See the full breakdown
Rockville is:
43.2% White with 29,260 White residents.
11.0% African American with 7,462 African American residents.
0.1% American Indian with 48 American Indian residents.
22.1% Asian with 14,962 Asian residents.
0.0% Hawaiian with 10 Hawaiian residents.
1.0% Other with 645 Other residents.
4.5% Two Or More with 3,042 Two Or More residents.
18.1% Hispanic with 12,242 Hispanic residents.
| Race | Rockville | MD | USA |
|---|---|---|---|
| White | 43.2% | 46.6% | 57.4% |
| African American | 11.0% | 28.9% | 11.9% |
| American Indian | 0.1% | 0.1% | 0.5% |
| Asian | 22.1% | 6.5% | 5.9% |
| Hawaiian | 0.0% | 0.0% | 0.2% |
| Other | 1.0% | 0.7% | 0.6% |
| Two Or More | 4.5% | 4.6% | 4.3% |
| Hispanic | 18.1% | 12.5% | 19.3% |
Gender in Rockville
See the full breakdown
Rockville is 52.4% female with 35,446 female residents.
Rockville is 47.6% male with 32,225 male residents.
| Gender | Rockville | MD | USA |
|---|---|---|---|
| Female | 52.4% | 51.3% | 50.5% |
| Male | 47.6% | 48.7% | 49.5% |
Highest level of educational attainment in Rockville for adults over 25
See the full breakdown
5.0% of adults in Rockville completed < 9th grade.
3.0% of adults in Rockville completed 9-12th grade.
11.0% of adults in Rockville completed high school / ged.
11.0% of adults in Rockville completed some college.
5.0% of adults in Rockville completed associate's degree.
27.0% of adults in Rockville completed bachelor's degree.
22.0% of adults in Rockville completed master's degree.
5.0% of adults in Rockville completed professional degree.
11.0% of adults in Rockville completed doctorate degree.
| Education | Rockville | MD | USA |
|---|---|---|---|
| < 9th Grade | 5.0% | 4.0% | 4.0% |
| 9-12th Grade | 3.0% | 5.0% | 6.0% |
| High School / GED | 11.0% | 23.0% | 26.0% |
| Some College | 11.0% | 17.0% | 19.0% |
| Associate's Degree | 5.0% | 7.0% | 9.0% |
| Bachelor's Degree | 27.0% | 23.0% | 22.0% |
| Master's Degree | 22.0% | 15.0% | 10.0% |
| Professional Degree | 5.0% | 3.0% | 2.0% |
| Doctorate Degree | 11.0% | 3.0% | 2.0% |
Household Income For Rockville, Maryland
See the full breakdown
4.1% of households in Rockville earn Less than $10,000.
2.2% of households in Rockville earn $10,000 to $14,999.
3.0% of households in Rockville earn $15,000 to $24,999.
3.9% of households in Rockville earn $25,000 to $34,999.
4.9% of households in Rockville earn $35,000 to $49,999.
10.4% of households in Rockville earn $50,000 to $74,999.
10.5% of households in Rockville earn $75,000 to $99,999.
18.9% of households in Rockville earn $100,000 to $149,999.
15.1% of households in Rockville earn $150,000 to $199,999.
26.9% of households in Rockville earn $200,000 or more.
| Income | Rockville | MD | USA |
|---|---|---|---|
| Less than $10,000 | 4.1% | 4.4% | 5.0% |
| $10,000 to $14,999 | 2.2% | 2.4% | 3.4% |
| $15,000 to $24,999 | 3.0% | 4.3% | 6.3% |
| $25,000 to $34,999 | 3.9% | 4.9% | 6.6% |
| $35,000 to $49,999 | 4.9% | 7.5% | 10.1% |
| $50,000 to $74,999 | 10.4% | 12.8% | 15.5% |
| $75,000 to $99,999 | 10.5% | 11.9% | 12.6% |
| $100,000 to $149,999 | 18.9% | 18.9% | 17.5% |
| $150,000 to $199,999 | 15.1% | 12.5% | 9.6% |
| $200,000 or more | 26.9% | 20.3% | 13.4% |
Source: U.S. Census ACS 5-year estimates (2024)


