Adrian SnackAbility
Overall SnackAbility
Crime in Adrian summary. We use data from the FBI to determine the crime rates in Adrian. Key points include:
There were 597 total crimes in Adrian in the last reporting year.
The overall crime rate per 100,000 people in Adrian is 2,968.2 / 100k people.
The violent crime rate per 100,000 people in Adrian is 571.8 / 100k people.
The property crime rate per 100,000 people in Adrian is 2,396.5 / 100k people.
Overall, crime in Adrian is 40.06% above the national average.
Total Crimes
Above National Average
Crime In Adrian Comparison Table
| Statistic | Count Raw |
Adrian / 100k People |
Michigan / 100k People |
National / 100k People |
|---|---|---|---|---|
| Total Crimes Per 100K | 597 | 2,968.2 | 1,813.2 | 2,119.2 |
| Violent Crime | 115 | 571.8 | 434.3 | 359.0 |
| Murder | 0 | 0.0 | 5.2 | 5.0 |
| Robbery | 6 | 29.8 | 31.3 | 61.0 |
| Aggravated Assault | 81 | 402.7 | 341.3 | 256.0 |
| Property Crime | 482 | 2,396.5 | 1,378.9 | 1,760.0 |
| Burglary | 77 | 382.8 | 184.2 | 229.0 |
| Larceny | 379 | 1,884.4 | 963.6 | 1,272.0 |
| Car Theft | 26 | 129.3 | 231.0 | 259.0 |
Source: FBI Uniform Crime Reporting (2024)
Cost of living in Adrian summary. We use data on the cost of living to determine how expensive it is to live in Adrian. Real estate prices drive most of the variance in cost of living around Michigan. Key points include:
The cost of living in Adrian is 84 with 100 being average.
The cost of living in Adrian is 0.8x lower than the national average.
The median home value in Adrian is $185,078.
The median income in Adrian is $50,209.
Adrian's Overall Cost Of Living
Lower Than The National Average
Cost Of Living In Adrian Comparison Table
| Living Expense | Adrian | Michigan | National Average |
|---|---|---|---|
| Overall | 84 | 91 | 100 |
| Services | 100 | 97 | 100 |
| Groceries | 94 | 98 | 100 |
| Health | 57 | 75 | 100 |
| Housing | 91 | 98 | 100 |
| Transportation | 94 | 101 | 100 |
| Utilities | 88 | 98 | 100 |
Source: Cost of living index, normalized to US average = 100
Adrian, MI Weather
The average high in Adrian is 59.1° and the average low is 38.3°.
There are 76.2 days of precipitation each year.
Expect an average of 36.0 inches of precipitation each year with 28.8 inches of snow.
| Stat | Adrian |
|---|---|
| Average Annual High | 59.1 |
| Average Annual Low | 38.3 |
| Annual Precipitation Days | 76.2 |
| Average Annual Precipitation | 36.0 |
| Average Annual Snowfall | 28.8 |
Average High
Days of Rain
Source: NOAA climate normals (30-year)
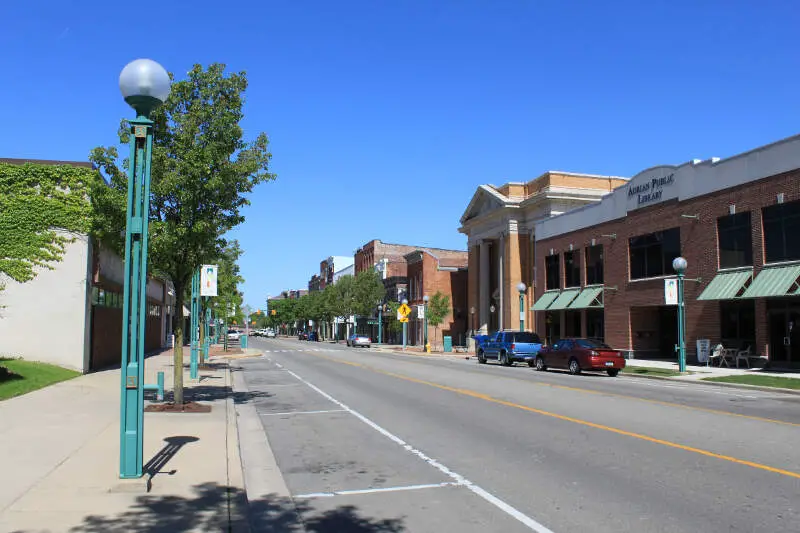
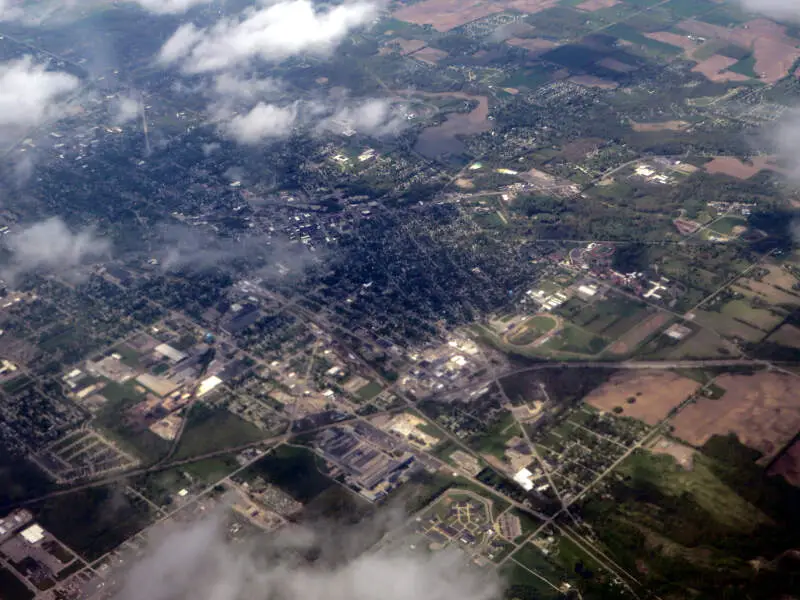
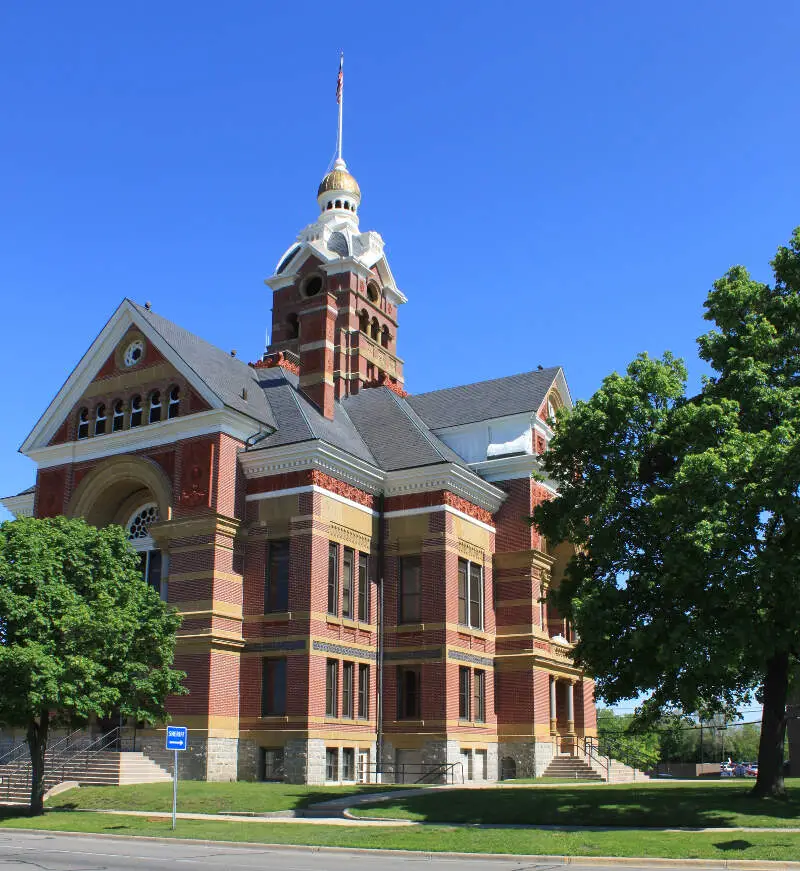
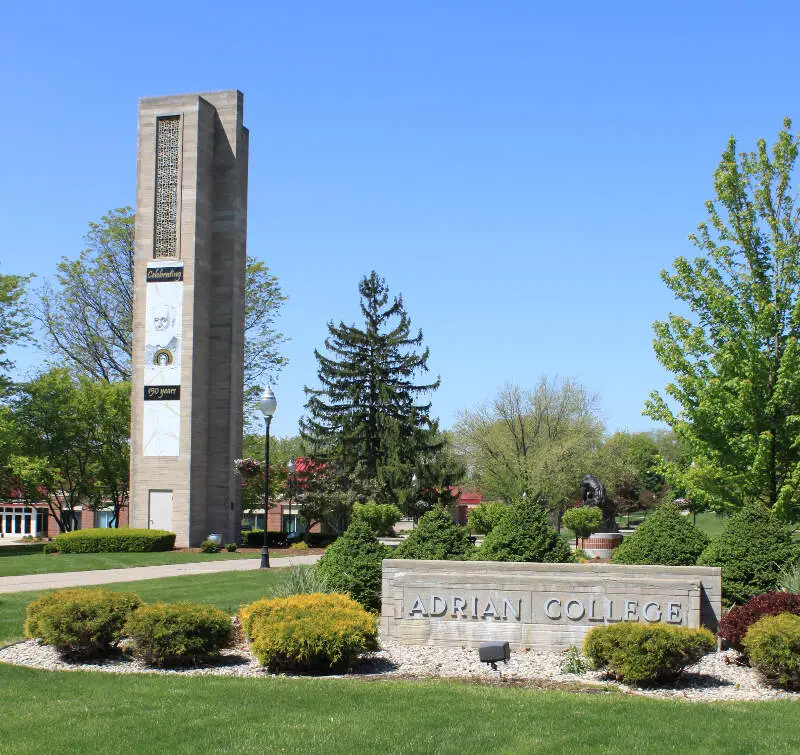
Adrian, MI Photos

Rankings & Articles For Adrian


Locations Around Adrian
Map Of Adrian, MI
Best Places Around Adrian
Perrysburg, OH
Population 25,181
Sylvania, OH
Population 19,055
Waterville, OH
Population 6,017
Rossford, OH
Population 6,323
Bowling Green, OH
Population 29,983
Maumee, OH
Population 13,715
Oregon, OH
Population 19,799
Wauseon, OH
Population 7,505
Defiance, OH
Population 17,276
Plymouth, MI
Population 9,214
Adrian Demographics And Statistics
Population over time in Adrian
The current population in Adrian is 20,395. The population has decreased 5.4% from 2010.
| Year | Population | % Change |
|---|---|---|
| 2024 | 20,395 | -0.5% |
| 2023 | 20,493 | -0.6% |
| 2022 | 20,607 | -0.3% |
| 2021 | 20,674 | 0.6% |
| 2020 | 20,550 | -0.1% |
| 2019 | 20,572 | -0.3% |
| 2018 | 20,640 | -0.5% |
| 2017 | 20,743 | -0.3% |
| 2016 | 20,800 | -0.4% |
| 2015 | 20,878 | -0.6% |
| 2014 | 21,008 | -0.2% |
| 2013 | 21,059 | -0.5% |
| 2012 | 21,170 | -1.0% |
| 2011 | 21,388 | -0.8% |
| 2010 | 21,554 | - |
Race / Ethnicity in Adrian
See the full breakdown
Adrian is:
71.0% White with 14,474 White residents.
4.3% African American with 870 African American residents.
0.1% American Indian with 11 American Indian residents.
0.3% Asian with 52 Asian residents.
0.0% Hawaiian with 0 Hawaiian residents.
0.4% Other with 85 Other residents.
3.3% Two Or More with 683 Two Or More residents.
20.7% Hispanic with 4,220 Hispanic residents.
| Race | Adrian | MI | USA |
|---|---|---|---|
| White | 71.0% | 72.4% | 57.4% |
| African American | 4.3% | 13.1% | 11.9% |
| American Indian | 0.1% | 0.3% | 0.5% |
| Asian | 0.3% | 3.4% | 5.9% |
| Hawaiian | 0.0% | 0.0% | 0.2% |
| Other | 0.4% | 0.5% | 0.6% |
| Two Or More | 3.3% | 4.5% | 4.3% |
| Hispanic | 20.7% | 5.9% | 19.3% |
Gender in Adrian
See the full breakdown
Adrian is 51.5% female with 10,510 female residents.
Adrian is 48.5% male with 9,885 male residents.
| Gender | Adrian | MI | USA |
|---|---|---|---|
| Female | 51.5% | 50.4% | 50.5% |
| Male | 48.5% | 49.6% | 49.5% |
Highest level of educational attainment in Adrian for adults over 25
See the full breakdown
3.0% of adults in Adrian completed < 9th grade.
9.0% of adults in Adrian completed 9-12th grade.
37.0% of adults in Adrian completed high school / ged.
22.0% of adults in Adrian completed some college.
8.0% of adults in Adrian completed associate's degree.
13.0% of adults in Adrian completed bachelor's degree.
7.0% of adults in Adrian completed master's degree.
0.0% of adults in Adrian completed professional degree.
1.0% of adults in Adrian completed doctorate degree.
| Education | Adrian | MI | USA |
|---|---|---|---|
| < 9th Grade | 3.0% | 3.0% | 4.0% |
| 9-12th Grade | 9.0% | 5.0% | 6.0% |
| High School / GED | 37.0% | 28.0% | 26.0% |
| Some College | 22.0% | 22.0% | 19.0% |
| Associate's Degree | 8.0% | 10.0% | 9.0% |
| Bachelor's Degree | 13.0% | 20.0% | 22.0% |
| Master's Degree | 7.0% | 9.0% | 10.0% |
| Professional Degree | 0.0% | 2.0% | 2.0% |
| Doctorate Degree | 1.0% | 1.0% | 2.0% |
Household Income For Adrian, Michigan
See the full breakdown
6.8% of households in Adrian earn Less than $10,000.
5.9% of households in Adrian earn $10,000 to $14,999.
12.4% of households in Adrian earn $15,000 to $24,999.
11.1% of households in Adrian earn $25,000 to $34,999.
13.6% of households in Adrian earn $35,000 to $49,999.
21.6% of households in Adrian earn $50,000 to $74,999.
12.1% of households in Adrian earn $75,000 to $99,999.
10.9% of households in Adrian earn $100,000 to $149,999.
3.1% of households in Adrian earn $150,000 to $199,999.
2.6% of households in Adrian earn $200,000 or more.
| Income | Adrian | MI | USA |
|---|---|---|---|
| Less than $10,000 | 6.8% | 5.2% | 5.0% |
| $10,000 to $14,999 | 5.9% | 3.8% | 3.4% |
| $15,000 to $24,999 | 12.4% | 6.8% | 6.3% |
| $25,000 to $34,999 | 11.1% | 7.3% | 6.6% |
| $35,000 to $49,999 | 13.6% | 11.4% | 10.1% |
| $50,000 to $74,999 | 21.6% | 16.8% | 15.5% |
| $75,000 to $99,999 | 12.1% | 13.2% | 12.6% |
| $100,000 to $149,999 | 10.9% | 17.3% | 17.5% |
| $150,000 to $199,999 | 3.1% | 8.6% | 9.6% |
| $200,000 or more | 2.6% | 9.5% | 13.4% |
Source: U.S. Census ACS 5-year estimates (2024)


