East Grand Rapids SnackAbility
Overall SnackAbility
Crime in East Grand Rapids summary. We use data from the FBI to determine the crime rates in East Grand Rapids. Key points include:
There were 131 total crimes in East Grand Rapids in the last reporting year.
The overall crime rate per 100,000 people in East Grand Rapids is 1,145.0 / 100k people.
The violent crime rate per 100,000 people in East Grand Rapids is 61.2 / 100k people.
The property crime rate per 100,000 people in East Grand Rapids is 1,083.8 / 100k people.
Overall, crime in East Grand Rapids is -45.97% below the national average.
Total Crimes
Below National Average
Crime In East Grand Rapids Comparison Table
| Statistic | Count Raw |
East Grand Rapids / 100k People |
Michigan / 100k People |
National / 100k People |
|---|---|---|---|---|
| Total Crimes Per 100K | 131 | 1,145.0 | 1,813.2 | 2,119.2 |
| Violent Crime | 7 | 61.2 | 434.3 | 359.0 |
| Murder | 0 | 0.0 | 5.2 | 5.0 |
| Robbery | 0 | 0.0 | 31.3 | 61.0 |
| Aggravated Assault | 5 | 43.7 | 341.3 | 256.0 |
| Property Crime | 124 | 1,083.8 | 1,378.9 | 1,760.0 |
| Burglary | 20 | 174.8 | 184.2 | 229.0 |
| Larceny | 90 | 786.6 | 963.6 | 1,272.0 |
| Car Theft | 14 | 122.4 | 231.0 | 259.0 |
Source: FBI Uniform Crime Reporting (2024)
Cost of living in East Grand Rapids summary. We use data on the cost of living to determine how expensive it is to live in East Grand Rapids. Real estate prices drive most of the variance in cost of living around Michigan. Key points include:
The cost of living in East Grand Rapids is 125 with 100 being average.
The cost of living in East Grand Rapids is 1.2x higher than the national average.
The median home value in East Grand Rapids is $664,183.
The median income in East Grand Rapids is $166,610.
East Grand Rapids's Overall Cost Of Living
Higher Than The National Average
Cost Of Living In East Grand Rapids Comparison Table
| Living Expense | East Grand Rapids | Michigan | National Average |
|---|---|---|---|
| Overall | 125 | 91 | 100 |
| Services | 98 | 97 | 100 |
| Groceries | 100 | 98 | 100 |
| Health | 192 | 75 | 100 |
| Housing | 100 | 98 | 100 |
| Transportation | 102 | 101 | 100 |
| Utilities | 97 | 98 | 100 |
Source: Cost of living index, normalized to US average = 100
East Grand Rapids, MI Weather
The average high in East Grand Rapids is 57.2° and the average low is 37.7°.
There are 77.9 days of precipitation each year.
Expect an average of 36.4 inches of precipitation each year with 66.4 inches of snow.
| Stat | East Grand Rapids |
|---|---|
| Average Annual High | 57.2 |
| Average Annual Low | 37.7 |
| Annual Precipitation Days | 77.9 |
| Average Annual Precipitation | 36.4 |
| Average Annual Snowfall | 66.4 |
Average High
Days of Rain
Source: NOAA climate normals (30-year)
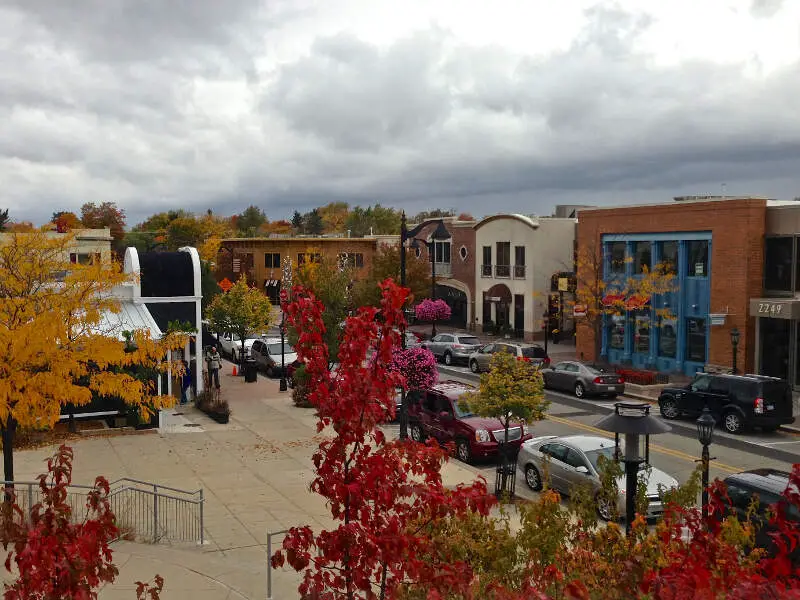
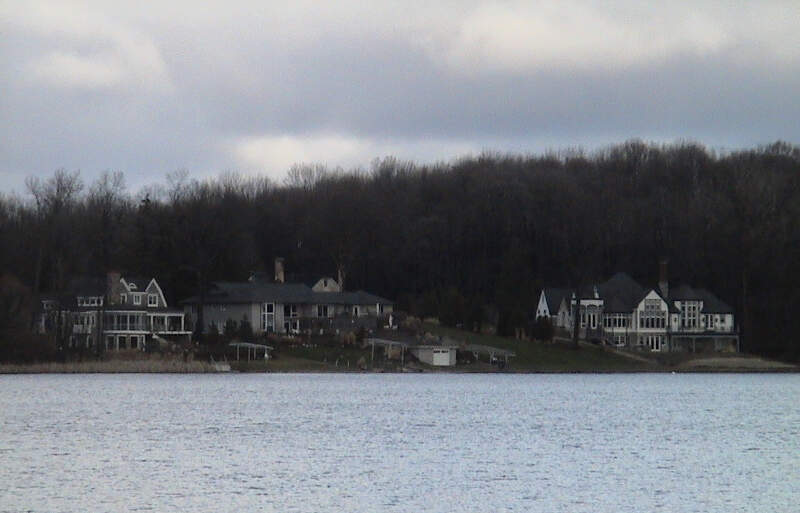
East Grand Rapids, MI Photos

Rankings & Articles For East Grand Rapids


Locations Around East Grand Rapids
Map Of East Grand Rapids, MI
Best Places Around East Grand Rapids
Forest Hills, MI
Population 28,695
Jenison, MI
Population 17,582
Byron Center, MI
Population 7,403
Hudsonville, MI
Population 7,769
Rockford, MI
Population 6,218
Northview, MI
Population 15,268
Wyoming, MI
Population 77,353
Kentwood, MI
Population 54,296
Cutlerville, MI
Population 18,780
Grandville, MI
Population 16,356
East Grand Rapids Demographics And Statistics
Population over time in East Grand Rapids
The current population in East Grand Rapids is 11,445. The population has increased 6.6% from 2010.
| Year | Population | % Change |
|---|---|---|
| 2024 | 11,445 | 0.4% |
| 2023 | 11,394 | 0.1% |
| 2022 | 11,385 | 0.0% |
| 2021 | 11,381 | -4.0% |
| 2020 | 11,855 | 0.8% |
| 2019 | 11,759 | 1.0% |
| 2018 | 11,642 | 1.3% |
| 2017 | 11,493 | 1.7% |
| 2016 | 11,297 | 1.5% |
| 2015 | 11,128 | 1.2% |
| 2014 | 10,999 | 1.0% |
| 2013 | 10,887 | 0.8% |
| 2012 | 10,797 | 0.5% |
| 2011 | 10,743 | 0.1% |
| 2010 | 10,734 | - |
Race / Ethnicity in East Grand Rapids
See the full breakdown
East Grand Rapids is:
88.9% White with 10,173 White residents.
1.4% African American with 163 African American residents.
0.0% American Indian with 1 American Indian residents.
2.3% Asian with 261 Asian residents.
0.0% Hawaiian with 0 Hawaiian residents.
0.7% Other with 82 Other residents.
4.0% Two Or More with 463 Two Or More residents.
2.6% Hispanic with 302 Hispanic residents.
| Race | East Grand Rapids | MI | USA |
|---|---|---|---|
| White | 88.9% | 72.4% | 57.4% |
| African American | 1.4% | 13.1% | 11.9% |
| American Indian | 0.0% | 0.3% | 0.5% |
| Asian | 2.3% | 3.4% | 5.9% |
| Hawaiian | 0.0% | 0.0% | 0.2% |
| Other | 0.7% | 0.5% | 0.6% |
| Two Or More | 4.0% | 4.5% | 4.3% |
| Hispanic | 2.6% | 5.9% | 19.3% |
Gender in East Grand Rapids
See the full breakdown
East Grand Rapids is 50.4% female with 5,764 female residents.
East Grand Rapids is 49.6% male with 5,681 male residents.
| Gender | East Grand Rapids | MI | USA |
|---|---|---|---|
| Female | 50.4% | 50.4% | 50.5% |
| Male | 49.6% | 49.6% | 49.5% |
Highest level of educational attainment in East Grand Rapids for adults over 25
See the full breakdown
1.0% of adults in East Grand Rapids completed < 9th grade.
1.0% of adults in East Grand Rapids completed 9-12th grade.
5.0% of adults in East Grand Rapids completed high school / ged.
8.0% of adults in East Grand Rapids completed some college.
6.0% of adults in East Grand Rapids completed associate's degree.
36.0% of adults in East Grand Rapids completed bachelor's degree.
28.0% of adults in East Grand Rapids completed master's degree.
9.0% of adults in East Grand Rapids completed professional degree.
6.0% of adults in East Grand Rapids completed doctorate degree.
| Education | East Grand Rapids | MI | USA |
|---|---|---|---|
| < 9th Grade | 1.0% | 3.0% | 4.0% |
| 9-12th Grade | 1.0% | 5.0% | 6.0% |
| High School / GED | 5.0% | 28.0% | 26.0% |
| Some College | 8.0% | 22.0% | 19.0% |
| Associate's Degree | 6.0% | 10.0% | 9.0% |
| Bachelor's Degree | 36.0% | 20.0% | 22.0% |
| Master's Degree | 28.0% | 9.0% | 10.0% |
| Professional Degree | 9.0% | 2.0% | 2.0% |
| Doctorate Degree | 6.0% | 1.0% | 2.0% |
Household Income For East Grand Rapids, Michigan
See the full breakdown
0.2% of households in East Grand Rapids earn Less than $10,000.
2.1% of households in East Grand Rapids earn $10,000 to $14,999.
1.5% of households in East Grand Rapids earn $15,000 to $24,999.
1.9% of households in East Grand Rapids earn $25,000 to $34,999.
1.7% of households in East Grand Rapids earn $35,000 to $49,999.
5.8% of households in East Grand Rapids earn $50,000 to $74,999.
11.4% of households in East Grand Rapids earn $75,000 to $99,999.
18.2% of households in East Grand Rapids earn $100,000 to $149,999.
14.2% of households in East Grand Rapids earn $150,000 to $199,999.
43.0% of households in East Grand Rapids earn $200,000 or more.
| Income | East Grand Rapids | MI | USA |
|---|---|---|---|
| Less than $10,000 | 0.2% | 5.2% | 5.0% |
| $10,000 to $14,999 | 2.1% | 3.8% | 3.4% |
| $15,000 to $24,999 | 1.5% | 6.8% | 6.3% |
| $25,000 to $34,999 | 1.9% | 7.3% | 6.6% |
| $35,000 to $49,999 | 1.7% | 11.4% | 10.1% |
| $50,000 to $74,999 | 5.8% | 16.8% | 15.5% |
| $75,000 to $99,999 | 11.4% | 13.2% | 12.6% |
| $100,000 to $149,999 | 18.2% | 17.3% | 17.5% |
| $150,000 to $199,999 | 14.2% | 8.6% | 9.6% |
| $200,000 or more | 43.0% | 9.5% | 13.4% |
Source: U.S. Census ACS 5-year estimates (2024)


