East Lansing SnackAbility
Overall SnackAbility
Crime in East Lansing summary. We use data from the FBI to determine the crime rates in East Lansing. Key points include:
There were 727 total crimes in East Lansing in the last reporting year.
The overall crime rate per 100,000 people in East Lansing is 1,440.4 / 100k people.
The violent crime rate per 100,000 people in East Lansing is 219.9 / 100k people.
The property crime rate per 100,000 people in East Lansing is 1,220.5 / 100k people.
Overall, crime in East Lansing is -32.03% below the national average.
Total Crimes
Below National Average
Crime In East Lansing Comparison Table
| Statistic | Count Raw |
East Lansing / 100k People |
Michigan / 100k People |
National / 100k People |
|---|---|---|---|---|
| Total Crimes Per 100K | 727 | 1,440.4 | 1,813.2 | 2,119.2 |
| Violent Crime | 111 | 219.9 | 434.3 | 359.0 |
| Murder | 2 | 4.0 | 5.2 | 5.0 |
| Robbery | 7 | 13.9 | 31.3 | 61.0 |
| Aggravated Assault | 83 | 164.4 | 341.3 | 256.0 |
| Property Crime | 616 | 1,220.5 | 1,378.9 | 1,760.0 |
| Burglary | 32 | 63.4 | 184.2 | 229.0 |
| Larceny | 497 | 984.7 | 963.6 | 1,272.0 |
| Car Theft | 87 | 172.4 | 231.0 | 259.0 |
Source: FBI Uniform Crime Reporting (2024)
Cost of living in East Lansing summary. We use data on the cost of living to determine how expensive it is to live in East Lansing. Real estate prices drive most of the variance in cost of living around Michigan. Key points include:
The cost of living in East Lansing is 102 with 100 being average.
The cost of living in East Lansing is 1.0x higher than the national average.
The median home value in East Lansing is $311,382.
The median income in East Lansing is $45,687.
East Lansing's Overall Cost Of Living
Higher Than The National Average
Cost Of Living In East Lansing Comparison Table
| Living Expense | East Lansing | Michigan | National Average |
|---|---|---|---|
| Overall | 102 | 91 | 100 |
| Services | 96 | 97 | 100 |
| Groceries | 99 | 98 | 100 |
| Health | 107 | 75 | 100 |
| Housing | 101 | 98 | 100 |
| Transportation | 99 | 101 | 100 |
| Utilities | 98 | 98 | 100 |
Source: Cost of living index, normalized to US average = 100
East Lansing, MI Weather
The average high in East Lansing is 57.1° and the average low is 37.9°.
There are 68.1 days of precipitation each year.
Expect an average of 32.8 inches of precipitation each year with 43.4 inches of snow.
| Stat | East Lansing |
|---|---|
| Average Annual High | 57.1 |
| Average Annual Low | 37.9 |
| Annual Precipitation Days | 68.1 |
| Average Annual Precipitation | 32.8 |
| Average Annual Snowfall | 43.4 |
Average High
Days of Rain
Source: NOAA climate normals (30-year)
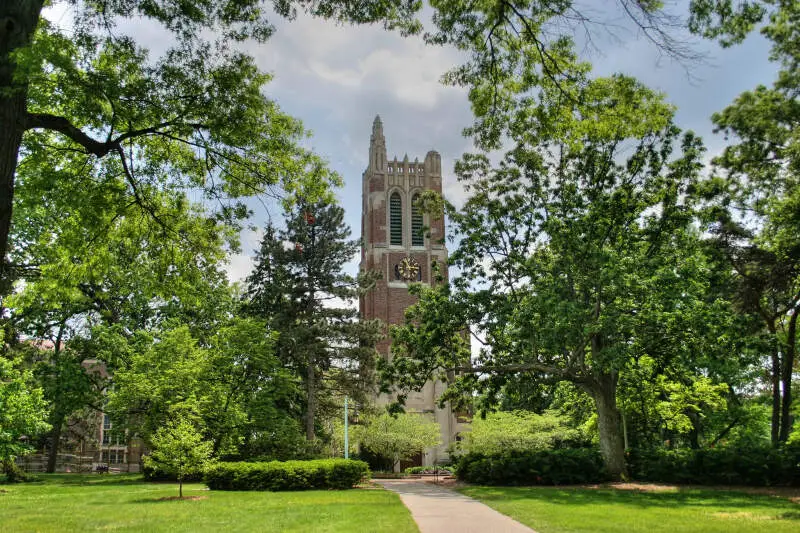
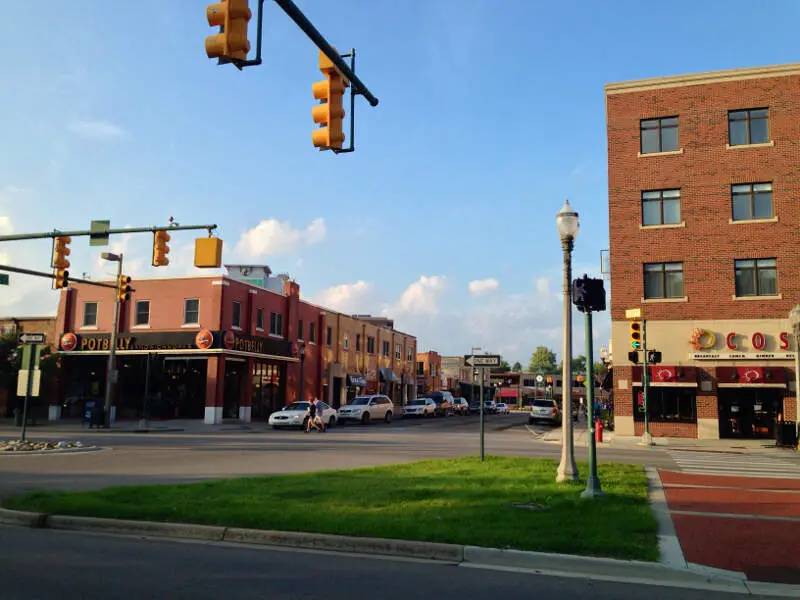
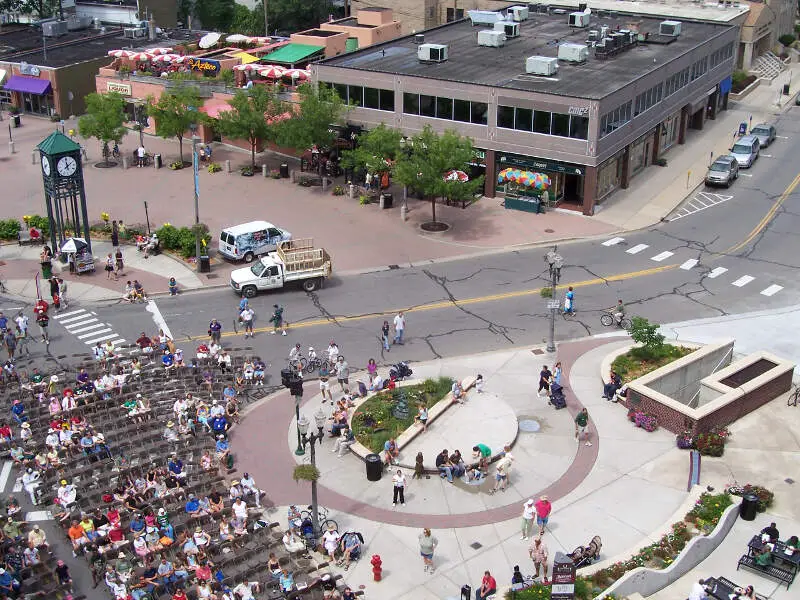
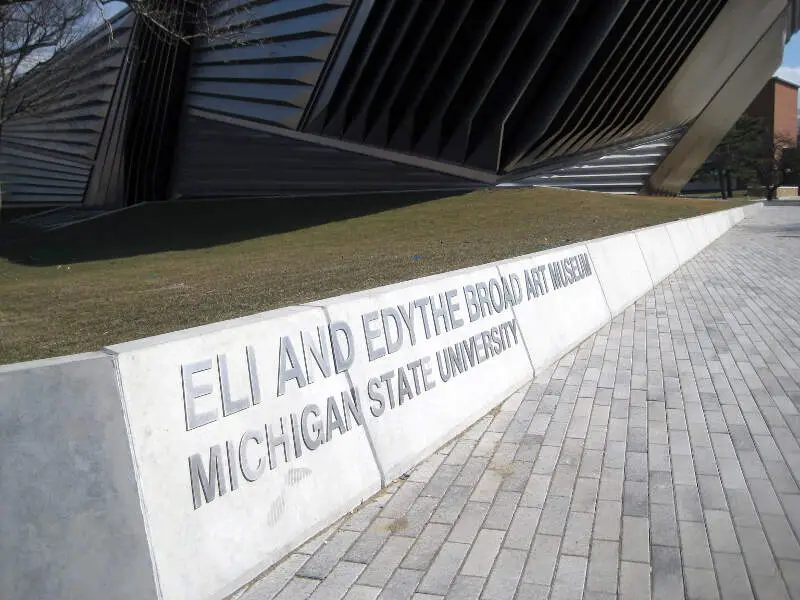
East Lansing, MI Photos
Rankings & Articles For East Lansing


Locations Around East Lansing
Map Of East Lansing, MI
Best Places Around East Lansing
Okemos, MI
Population 26,396
Holt, MI
Population 25,316
Mason, MI
Population 8,249
Haslett, MI
Population 18,559
Grand Ledge, MI
Population 7,804
Waverly, MI
Population 23,575
St. Johns, MI
Population 7,715
Eaton Rapids, MI
Population 5,183
Lansing, MI
Population 113,023
East Lansing Demographics And Statistics
Population over time in East Lansing
The current population in East Lansing is 45,758. The population has decreased 5.1% from 2010.
| Year | Population | % Change |
|---|---|---|
| 2024 | 45,758 | 0.8% |
| 2023 | 45,394 | -0.0% |
| 2022 | 45,403 | -4.3% |
| 2021 | 47,427 | -2.1% |
| 2020 | 48,437 | -0.6% |
| 2019 | 48,729 | 0.7% |
| 2018 | 48,374 | 0.2% |
| 2017 | 48,281 | -0.2% |
| 2016 | 48,395 | -0.6% |
| 2015 | 48,669 | 0.1% |
| 2014 | 48,611 | 0.1% |
| 2013 | 48,556 | 0.2% |
| 2012 | 48,449 | 0.0% |
| 2011 | 48,441 | 0.5% |
| 2010 | 48,220 | - |
Race / Ethnicity in East Lansing
See the full breakdown
East Lansing is:
71.5% White with 32,700 White residents.
7.6% African American with 3,460 African American residents.
0.2% American Indian with 81 American Indian residents.
8.9% Asian with 4,089 Asian residents.
0.0% Hawaiian with 0 Hawaiian residents.
0.3% Other with 156 Other residents.
4.9% Two Or More with 2,264 Two Or More residents.
6.6% Hispanic with 3,008 Hispanic residents.
| Race | East Lansing | MI | USA |
|---|---|---|---|
| White | 71.5% | 72.4% | 57.4% |
| African American | 7.6% | 13.1% | 11.9% |
| American Indian | 0.2% | 0.3% | 0.5% |
| Asian | 8.9% | 3.4% | 5.9% |
| Hawaiian | 0.0% | 0.0% | 0.2% |
| Other | 0.3% | 0.5% | 0.6% |
| Two Or More | 4.9% | 4.5% | 4.3% |
| Hispanic | 6.6% | 5.9% | 19.3% |
Gender in East Lansing
See the full breakdown
East Lansing is 52.0% female with 23,815 female residents.
East Lansing is 48.0% male with 21,943 male residents.
| Gender | East Lansing | MI | USA |
|---|---|---|---|
| Female | 52.0% | 50.4% | 50.5% |
| Male | 48.0% | 49.6% | 49.5% |
Highest level of educational attainment in East Lansing for adults over 25
See the full breakdown
1.0% of adults in East Lansing completed < 9th grade.
1.0% of adults in East Lansing completed 9-12th grade.
12.0% of adults in East Lansing completed high school / ged.
14.0% of adults in East Lansing completed some college.
5.0% of adults in East Lansing completed associate's degree.
27.0% of adults in East Lansing completed bachelor's degree.
20.0% of adults in East Lansing completed master's degree.
7.0% of adults in East Lansing completed professional degree.
13.0% of adults in East Lansing completed doctorate degree.
| Education | East Lansing | MI | USA |
|---|---|---|---|
| < 9th Grade | 1.0% | 3.0% | 4.0% |
| 9-12th Grade | 1.0% | 5.0% | 6.0% |
| High School / GED | 12.0% | 28.0% | 26.0% |
| Some College | 14.0% | 22.0% | 19.0% |
| Associate's Degree | 5.0% | 10.0% | 9.0% |
| Bachelor's Degree | 27.0% | 20.0% | 22.0% |
| Master's Degree | 20.0% | 9.0% | 10.0% |
| Professional Degree | 7.0% | 2.0% | 2.0% |
| Doctorate Degree | 13.0% | 1.0% | 2.0% |
Household Income For East Lansing, Michigan
See the full breakdown
13.8% of households in East Lansing earn Less than $10,000.
7.5% of households in East Lansing earn $10,000 to $14,999.
8.8% of households in East Lansing earn $15,000 to $24,999.
10.1% of households in East Lansing earn $25,000 to $34,999.
12.6% of households in East Lansing earn $35,000 to $49,999.
11.3% of households in East Lansing earn $50,000 to $74,999.
7.3% of households in East Lansing earn $75,000 to $99,999.
11.7% of households in East Lansing earn $100,000 to $149,999.
8.1% of households in East Lansing earn $150,000 to $199,999.
8.8% of households in East Lansing earn $200,000 or more.
| Income | East Lansing | MI | USA |
|---|---|---|---|
| Less than $10,000 | 13.8% | 5.2% | 5.0% |
| $10,000 to $14,999 | 7.5% | 3.8% | 3.4% |
| $15,000 to $24,999 | 8.8% | 6.8% | 6.3% |
| $25,000 to $34,999 | 10.1% | 7.3% | 6.6% |
| $35,000 to $49,999 | 12.6% | 11.4% | 10.1% |
| $50,000 to $74,999 | 11.3% | 16.8% | 15.5% |
| $75,000 to $99,999 | 7.3% | 13.2% | 12.6% |
| $100,000 to $149,999 | 11.7% | 17.3% | 17.5% |
| $150,000 to $199,999 | 8.1% | 8.6% | 9.6% |
| $200,000 or more | 8.8% | 9.5% | 13.4% |
Source: U.S. Census ACS 5-year estimates (2024)


