Gladstone SnackAbility
Overall SnackAbility
Crime in Gladstone summary. We use data from the FBI to determine the crime rates in Gladstone. Key points include:
There were 27 total crimes in Gladstone in the last reporting year.
The overall crime rate per 100,000 people in Gladstone is 516.1 / 100k people.
The violent crime rate per 100,000 people in Gladstone is 38.2 / 100k people.
The property crime rate per 100,000 people in Gladstone is 477.8 / 100k people.
Overall, crime in Gladstone is -75.65% below the national average.
Total Crimes
Below National Average
Crime In Gladstone Comparison Table
| Statistic | Count Raw |
Gladstone / 100k People |
Michigan / 100k People |
National / 100k People |
|---|---|---|---|---|
| Total Crimes Per 100K | 27 | 516.1 | 1,813.2 | 2,119.2 |
| Violent Crime | 2 | 38.2 | 434.3 | 359.0 |
| Murder | 0 | 0.0 | 5.2 | 5.0 |
| Robbery | 0 | 0.0 | 31.3 | 61.0 |
| Aggravated Assault | 2 | 38.2 | 341.3 | 256.0 |
| Property Crime | 25 | 477.8 | 1,378.9 | 1,760.0 |
| Burglary | 2 | 38.2 | 184.2 | 229.0 |
| Larceny | 22 | 420.5 | 963.6 | 1,272.0 |
| Car Theft | 1 | 19.1 | 231.0 | 259.0 |
Source: FBI Uniform Crime Reporting (2024)
Gladstone, MI Weather
The average high in Gladstone is 52.8° and the average low is 32.2°.
There are 66.2 days of precipitation each year.
Expect an average of 28.8 inches of precipitation each year with 48.4 inches of snow.
| Stat | Gladstone |
|---|---|
| Average Annual High | 52.8 |
| Average Annual Low | 32.2 |
| Annual Precipitation Days | 66.2 |
| Average Annual Precipitation | 28.8 |
| Average Annual Snowfall | 48.4 |
Average High
Days of Rain
Source: NOAA climate normals (30-year)
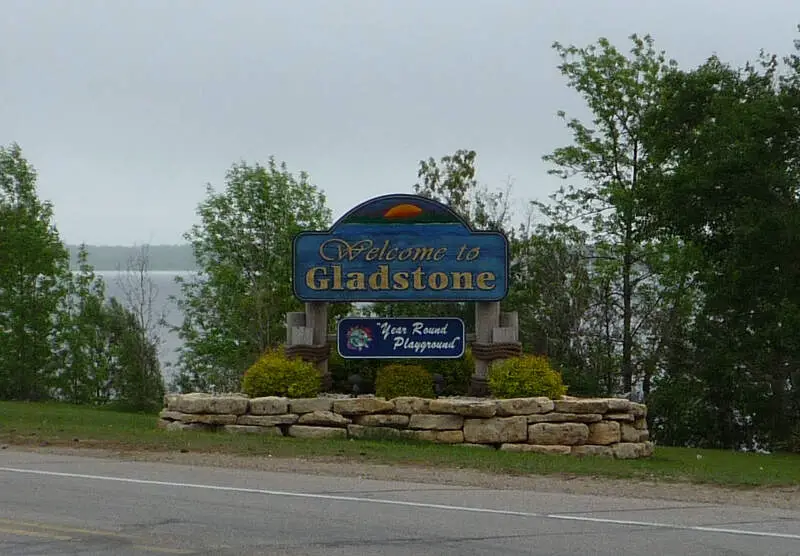
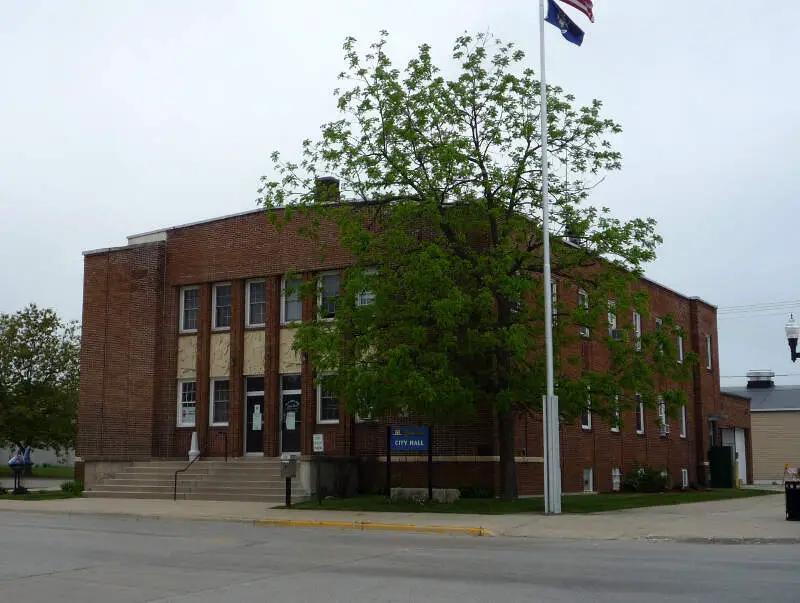
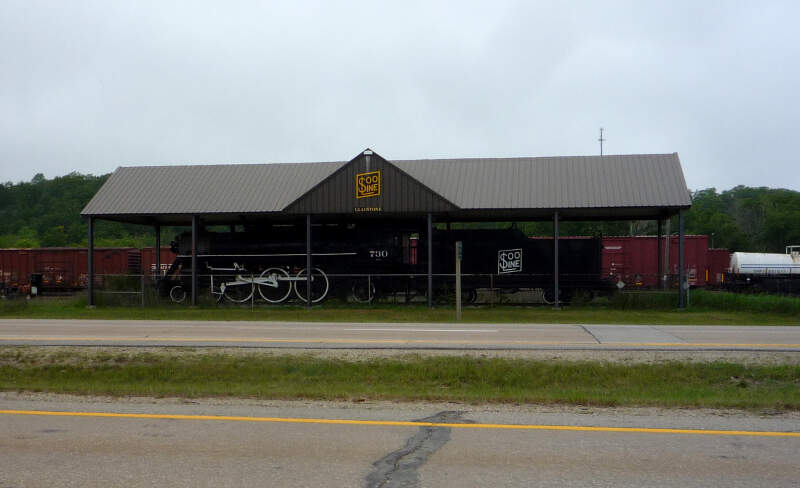
Gladstone, MI Photos
Rankings & Articles For Gladstone


Locations Around Gladstone
Map Of Gladstone, MI
Gladstone Demographics And Statistics
Population over time in Gladstone
The current population in Gladstone is 5,253. The population has increased 5.1% from 2010.
| Year | Population | % Change |
|---|---|---|
| 2024 | 5,253 | 0.2% |
| 2023 | 5,240 | 0.2% |
| 2022 | 5,231 | 0.4% |
| 2021 | 5,210 | 10.7% |
| 2020 | 4,708 | -0.9% |
| 2019 | 4,753 | -0.9% |
| 2018 | 4,794 | -0.6% |
| 2017 | 4,824 | -0.9% |
| 2016 | 4,867 | -0.7% |
| 2015 | 4,902 | -0.4% |
| 2014 | 4,920 | -0.6% |
| 2013 | 4,952 | -0.2% |
| 2012 | 4,960 | -0.6% |
| 2011 | 4,990 | -0.2% |
| 2010 | 5,000 | - |
Race / Ethnicity in Gladstone
See the full breakdown
Gladstone is:
93.7% White with 4,921 White residents.
0.0% African American with 0 African American residents.
0.7% American Indian with 36 American Indian residents.
0.0% Asian with 0 Asian residents.
0.0% Hawaiian with 0 Hawaiian residents.
0.6% Other with 31 Other residents.
4.6% Two Or More with 243 Two Or More residents.
0.4% Hispanic with 22 Hispanic residents.
| Race | Gladstone | MI | USA |
|---|---|---|---|
| White | 93.7% | 72.4% | 57.4% |
| African American | 0.0% | 13.1% | 11.9% |
| American Indian | 0.7% | 0.3% | 0.5% |
| Asian | 0.0% | 3.4% | 5.9% |
| Hawaiian | 0.0% | 0.0% | 0.2% |
| Other | 0.6% | 0.5% | 0.6% |
| Two Or More | 4.6% | 4.5% | 4.3% |
| Hispanic | 0.4% | 5.9% | 19.3% |
Gender in Gladstone
See the full breakdown
Gladstone is 50.0% female with 2,629 female residents.
Gladstone is 50.0% male with 2,624 male residents.
| Gender | Gladstone | MI | USA |
|---|---|---|---|
| Female | 50.0% | 50.4% | 50.5% |
| Male | 50.0% | 49.6% | 49.5% |
Highest level of educational attainment in Gladstone for adults over 25
See the full breakdown
2.0% of adults in Gladstone completed < 9th grade.
6.0% of adults in Gladstone completed 9-12th grade.
37.0% of adults in Gladstone completed high school / ged.
23.0% of adults in Gladstone completed some college.
13.0% of adults in Gladstone completed associate's degree.
16.0% of adults in Gladstone completed bachelor's degree.
3.0% of adults in Gladstone completed master's degree.
0.0% of adults in Gladstone completed professional degree.
0.0% of adults in Gladstone completed doctorate degree.
| Education | Gladstone | MI | USA |
|---|---|---|---|
| < 9th Grade | 2.0% | 3.0% | 4.0% |
| 9-12th Grade | 6.0% | 5.0% | 6.0% |
| High School / GED | 37.0% | 28.0% | 26.0% |
| Some College | 23.0% | 22.0% | 19.0% |
| Associate's Degree | 13.0% | 10.0% | 9.0% |
| Bachelor's Degree | 16.0% | 20.0% | 22.0% |
| Master's Degree | 3.0% | 9.0% | 10.0% |
| Professional Degree | 0.0% | 2.0% | 2.0% |
| Doctorate Degree | 0.0% | 1.0% | 2.0% |
Household Income For Gladstone, Michigan
See the full breakdown
6.1% of households in Gladstone earn Less than $10,000.
3.7% of households in Gladstone earn $10,000 to $14,999.
5.4% of households in Gladstone earn $15,000 to $24,999.
14.8% of households in Gladstone earn $25,000 to $34,999.
8.4% of households in Gladstone earn $35,000 to $49,999.
26.7% of households in Gladstone earn $50,000 to $74,999.
11.9% of households in Gladstone earn $75,000 to $99,999.
13.9% of households in Gladstone earn $100,000 to $149,999.
5.8% of households in Gladstone earn $150,000 to $199,999.
3.5% of households in Gladstone earn $200,000 or more.
| Income | Gladstone | MI | USA |
|---|---|---|---|
| Less than $10,000 | 6.1% | 5.2% | 5.0% |
| $10,000 to $14,999 | 3.7% | 3.8% | 3.4% |
| $15,000 to $24,999 | 5.4% | 6.8% | 6.3% |
| $25,000 to $34,999 | 14.8% | 7.3% | 6.6% |
| $35,000 to $49,999 | 8.4% | 11.4% | 10.1% |
| $50,000 to $74,999 | 26.7% | 16.8% | 15.5% |
| $75,000 to $99,999 | 11.9% | 13.2% | 12.6% |
| $100,000 to $149,999 | 13.9% | 17.3% | 17.5% |
| $150,000 to $199,999 | 5.8% | 8.6% | 9.6% |
| $200,000 or more | 3.5% | 9.5% | 13.4% |
Source: U.S. Census ACS 5-year estimates (2024)


