Holland SnackAbility
Overall SnackAbility
Crime in Holland summary. We use data from the FBI to determine the crime rates in Holland. Key points include:
There were 559 total crimes in Holland in the last reporting year.
The overall crime rate per 100,000 people in Holland is 1,615.4 / 100k people.
The violent crime rate per 100,000 people in Holland is 384.3 / 100k people.
The property crime rate per 100,000 people in Holland is 1,231.1 / 100k people.
Overall, crime in Holland is -23.77% below the national average.
Total Crimes
Below National Average
Crime In Holland Comparison Table
| Statistic | Count Raw |
Holland / 100k People |
Michigan / 100k People |
National / 100k People |
|---|---|---|---|---|
| Total Crimes Per 100K | 559 | 1,615.4 | 1,813.2 | 2,119.2 |
| Violent Crime | 133 | 384.3 | 434.3 | 359.0 |
| Murder | 1 | 2.9 | 5.2 | 5.0 |
| Robbery | 8 | 23.1 | 31.3 | 61.0 |
| Aggravated Assault | 89 | 257.2 | 341.3 | 256.0 |
| Property Crime | 426 | 1,231.1 | 1,378.9 | 1,760.0 |
| Burglary | 35 | 101.1 | 184.2 | 229.0 |
| Larceny | 363 | 1,049.0 | 963.6 | 1,272.0 |
| Car Theft | 28 | 80.9 | 231.0 | 259.0 |
Source: FBI Uniform Crime Reporting (2024)
Cost of living in Holland summary. We use data on the cost of living to determine how expensive it is to live in Holland. Real estate prices drive most of the variance in cost of living around Michigan. Key points include:
The cost of living in Holland is 98 with 100 being average.
The cost of living in Holland is 1.0x lower than the national average.
The median home value in Holland is $364,546.
The median income in Holland is $75,865.
Holland's Overall Cost Of Living
Lower Than The National Average
Cost Of Living In Holland Comparison Table
| Living Expense | Holland | Michigan | National Average |
|---|---|---|---|
| Overall | 98 | 91 | 100 |
| Services | 101 | 97 | 100 |
| Groceries | 100 | 98 | 100 |
| Health | 92 | 75 | 100 |
| Housing | 98 | 98 | 100 |
| Transportation | 99 | 101 | 100 |
| Utilities | 98 | 98 | 100 |
Source: Cost of living index, normalized to US average = 100
Holland, MI Weather
The average high in Holland is 57.7° and the average low is 40.1°.
There are 71.3 days of precipitation each year.
Expect an average of 36.0 inches of precipitation each year with 75.8 inches of snow.
| Stat | Holland |
|---|---|
| Average Annual High | 57.7 |
| Average Annual Low | 40.1 |
| Annual Precipitation Days | 71.3 |
| Average Annual Precipitation | 36.0 |
| Average Annual Snowfall | 75.8 |
Average High
Days of Rain
Source: NOAA climate normals (30-year)
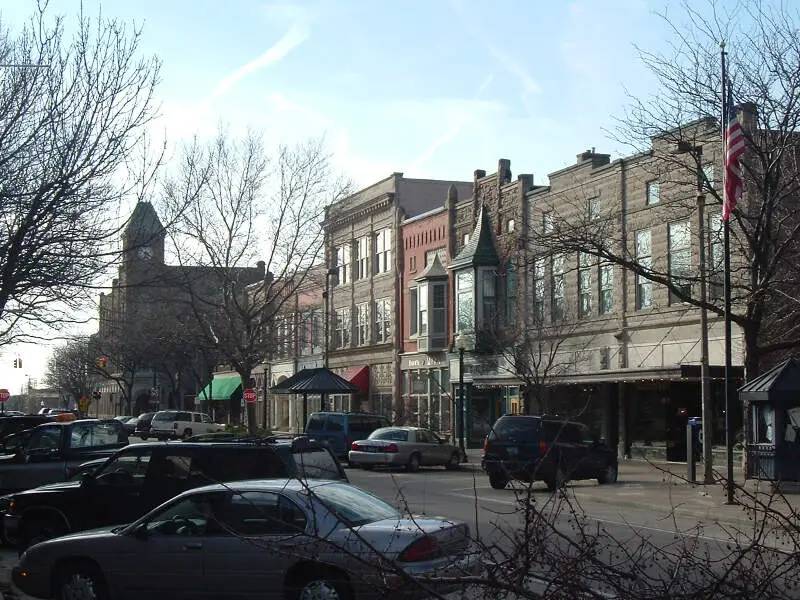
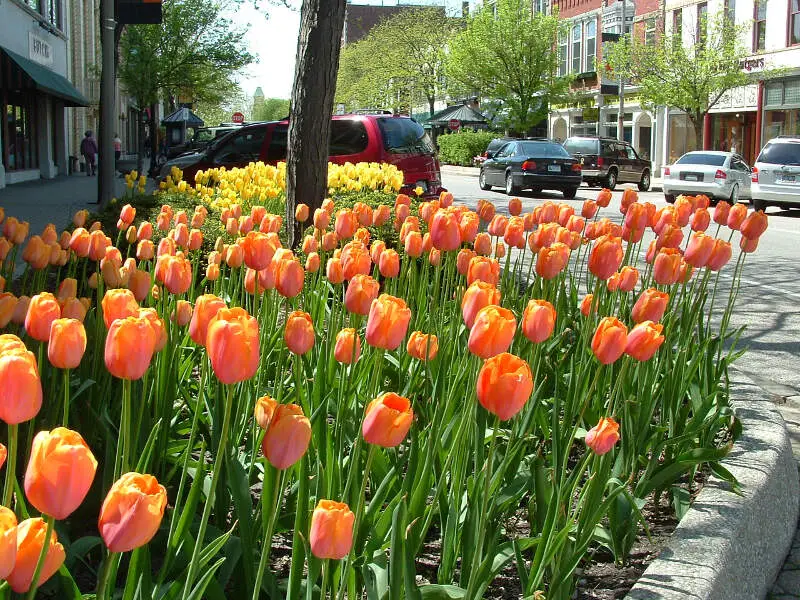
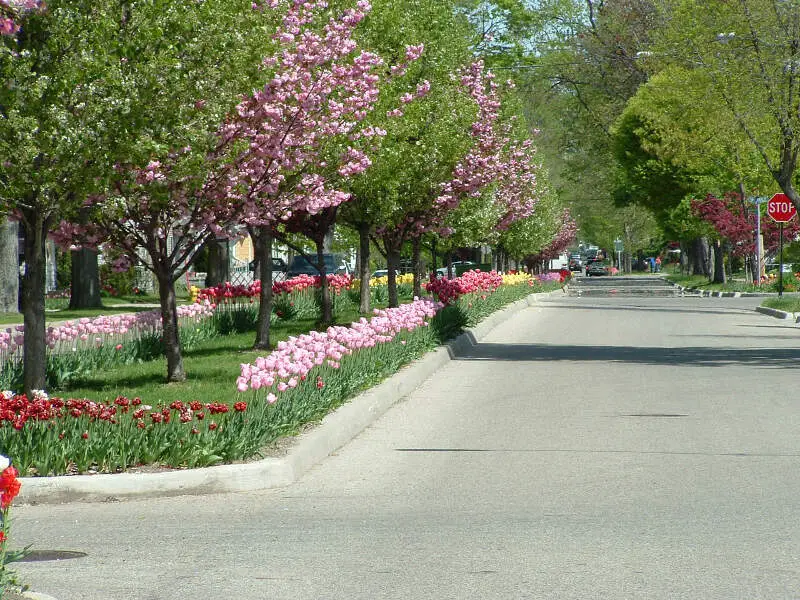
Holland, MI Photos


1 Reviews & Comments About Holland

Holland Michigan is a BEAUTIFUL area! I visited family in the area and they showed me everything this place has to offer!
Saugatuck Dunes State Park was amazing! The best stop of the trip for sure! The scenery was beautiful and the people were as friendly as can be. Can't wait to return!
Rankings & Articles For Holland


Locations Around Holland
Map Of Holland, MI
Best Places Around Holland
Jenison, MI
Population 17,582
Byron Center, MI
Population 7,403
Hudsonville, MI
Population 7,769
Grandville, MI
Population 16,356
Allendale, MI
Population 26,679
Zeeland, MI
Population 5,665
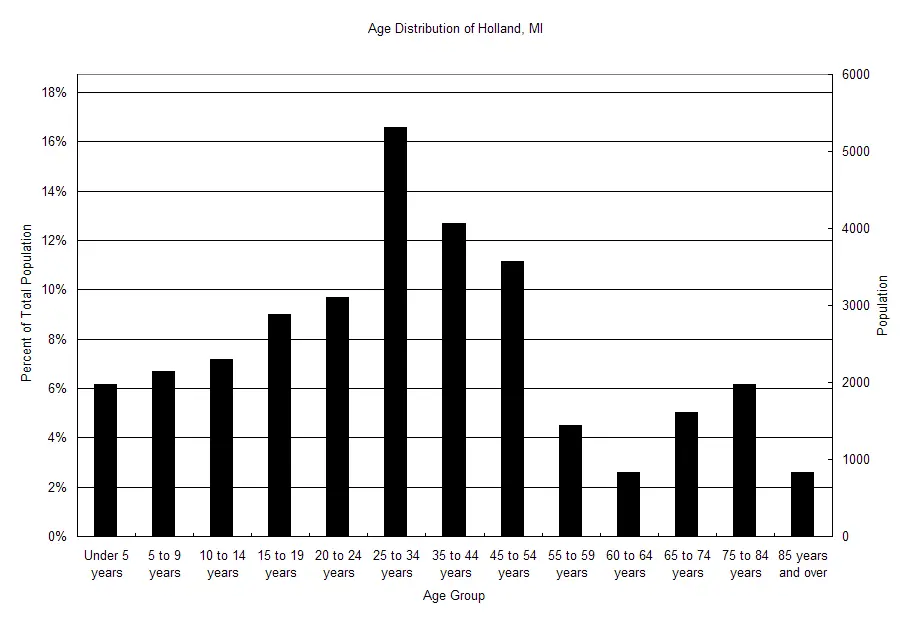
Holland Demographics And Statistics
Population over time in Holland
The current population in Holland is 34,423. The population has increased 2.1% from 2010.
| Year | Population | % Change |
|---|---|---|
| 2024 | 34,423 | 0.5% |
| 2023 | 34,266 | 0.2% |
| 2022 | 34,186 | 0.3% |
| 2021 | 34,067 | 2.2% |
| 2020 | 33,329 | -0.2% |
| 2019 | 33,402 | -0.3% |
| 2018 | 33,503 | 0.0% |
| 2017 | 33,488 | -0.3% |
| 2016 | 33,581 | 0.2% |
| 2015 | 33,526 | 0.6% |
| 2014 | 33,342 | 0.2% |
| 2013 | 33,281 | -0.1% |
| 2012 | 33,307 | -0.6% |
| 2011 | 33,503 | -0.6% |
| 2010 | 33,708 | - |
Race / Ethnicity in Holland
See the full breakdown
Holland is:
65.1% White with 22,396 White residents.
4.1% African American with 1,403 African American residents.
0.1% American Indian with 45 American Indian residents.
3.4% Asian with 1,185 Asian residents.
0.0% Hawaiian with 0 Hawaiian residents.
0.2% Other with 60 Other residents.
3.6% Two Or More with 1,225 Two Or More residents.
23.6% Hispanic with 8,109 Hispanic residents.
| Race | Holland | MI | USA |
|---|---|---|---|
| White | 65.1% | 72.4% | 57.4% |
| African American | 4.1% | 13.1% | 11.9% |
| American Indian | 0.1% | 0.3% | 0.5% |
| Asian | 3.4% | 3.4% | 5.9% |
| Hawaiian | 0.0% | 0.0% | 0.2% |
| Other | 0.2% | 0.5% | 0.6% |
| Two Or More | 3.6% | 4.5% | 4.3% |
| Hispanic | 23.6% | 5.9% | 19.3% |
Gender in Holland
See the full breakdown
Holland is 52.6% female with 18,101 female residents.
Holland is 47.4% male with 16,322 male residents.
| Gender | Holland | MI | USA |
|---|---|---|---|
| Female | 52.6% | 50.4% | 50.5% |
| Male | 47.4% | 49.6% | 49.5% |
Highest level of educational attainment in Holland for adults over 25
See the full breakdown
4.0% of adults in Holland completed < 9th grade.
5.0% of adults in Holland completed 9-12th grade.
26.0% of adults in Holland completed high school / ged.
22.0% of adults in Holland completed some college.
7.0% of adults in Holland completed associate's degree.
20.0% of adults in Holland completed bachelor's degree.
13.0% of adults in Holland completed master's degree.
2.0% of adults in Holland completed professional degree.
1.0% of adults in Holland completed doctorate degree.
| Education | Holland | MI | USA |
|---|---|---|---|
| < 9th Grade | 4.0% | 3.0% | 4.0% |
| 9-12th Grade | 5.0% | 5.0% | 6.0% |
| High School / GED | 26.0% | 28.0% | 26.0% |
| Some College | 22.0% | 22.0% | 19.0% |
| Associate's Degree | 7.0% | 10.0% | 9.0% |
| Bachelor's Degree | 20.0% | 20.0% | 22.0% |
| Master's Degree | 13.0% | 9.0% | 10.0% |
| Professional Degree | 2.0% | 2.0% | 2.0% |
| Doctorate Degree | 1.0% | 1.0% | 2.0% |
Household Income For Holland, Michigan
See the full breakdown
2.4% of households in Holland earn Less than $10,000.
2.4% of households in Holland earn $10,000 to $14,999.
5.0% of households in Holland earn $15,000 to $24,999.
9.8% of households in Holland earn $25,000 to $34,999.
11.0% of households in Holland earn $35,000 to $49,999.
18.9% of households in Holland earn $50,000 to $74,999.
16.8% of households in Holland earn $75,000 to $99,999.
19.7% of households in Holland earn $100,000 to $149,999.
7.2% of households in Holland earn $150,000 to $199,999.
6.8% of households in Holland earn $200,000 or more.
| Income | Holland | MI | USA |
|---|---|---|---|
| Less than $10,000 | 2.4% | 5.2% | 5.0% |
| $10,000 to $14,999 | 2.4% | 3.8% | 3.4% |
| $15,000 to $24,999 | 5.0% | 6.8% | 6.3% |
| $25,000 to $34,999 | 9.8% | 7.3% | 6.6% |
| $35,000 to $49,999 | 11.0% | 11.4% | 10.1% |
| $50,000 to $74,999 | 18.9% | 16.8% | 15.5% |
| $75,000 to $99,999 | 16.8% | 13.2% | 12.6% |
| $100,000 to $149,999 | 19.7% | 17.3% | 17.5% |
| $150,000 to $199,999 | 7.2% | 8.6% | 9.6% |
| $200,000 or more | 6.8% | 9.5% | 13.4% |
Source: U.S. Census ACS 5-year estimates (2024)


