Livonia, MI
Demographics And Statistics
Living In Livonia, Michigan Summary
Life in Livonia research summary. HomeSnacks has been using Saturday Night Science to research the quality of life in Livonia over the past nine years using Census, FBI, Zillow, and other primary data sources. Based on the most recently available data, we found the following about life in Livonia:
The population in Livonia is 94,058.
The median home value in Livonia is $304,865.
The median income in Livonia is $96,317.
The cost of living in Livonia is 104 which is 1.0x higher than the national average.
The median rent in Livonia is $1,284.
The unemployment rate in Livonia is 4.6%.
The poverty rate in Livonia is 4.7%.
The average high in Livonia is 58.8° and the average low is 40.4°.
Livonia SnackAbility
Overall SnackAbility
Livonia, MI Crime Report
Crime in Livonia summary. We use data from the FBI to determine the crime rates in Livonia. Key points include:
There were 1,359 total crimes in Livonia in the last reporting year.
The overall crime rate per 100,000 people in Livonia is 1,490.3 / 100k people.
The violent crime rate per 100,000 people in Livonia is 228.1 / 100k people.
The property crime rate per 100,000 people in Livonia is 1,262.2 / 100k people.
Overall, crime in Livonia is -29.68% below the national average.
Total Crimes
Below National Average
Crime In Livonia Comparison Table
| Statistic | Count Raw |
Livonia / 100k People |
Michigan / 100k People |
National / 100k People |
|---|---|---|---|---|
| Total Crimes Per 100K | 1,359 | 1,490.3 | 1,813.2 | 2,119.2 |
| Violent Crime | 208 | 228.1 | 434.3 | 359.0 |
| Murder | 0 | 0.0 | 5.2 | 5.0 |
| Robbery | 14 | 15.4 | 31.3 | 61.0 |
| Aggravated Assault | 174 | 190.8 | 341.3 | 256.0 |
| Property Crime | 1,151 | 1,262.2 | 1,378.9 | 1,760.0 |
| Burglary | 75 | 82.2 | 184.2 | 229.0 |
| Larceny | 922 | 1,011.1 | 963.6 | 1,272.0 |
| Car Theft | 154 | 168.9 | 231.0 | 259.0 |
Livonia, MI Cost Of Living
Cost of living in Livonia summary. We use data on the cost of living to determine how expensive it is to live in Livonia. Real estate prices drive most of the variance in cost of living around Michigan. Key points include:
The cost of living in Livonia is 104 with 100 being average.
The cost of living in Livonia is 1.0x higher than the national average.
The median home value in Livonia is $304,865.
The median income in Livonia is $96,317.
Livonia's Overall Cost Of Living
Higher Than The National Average
Cost Of Living In Livonia Comparison Table
| Living Expense | Livonia | Michigan | National Average | |
|---|---|---|---|---|
| Overall | 104 | 90 | 100 | |
| Services | 104 | 93 | 100 | |
| Groceries | 103 | 97 | 100 | |
| Health | 103 | 91 | 100 | |
| Housing | 113 | 72 | 100 | |
| Transportation | 102 | 96 | 100 | |
| Utilities | 94 | 99 | 100 | |
Livonia, MI Weather
The average high in Livonia is 58.8° and the average low is 40.4°.
There are 73.7 days of precipitation each year.
Expect an average of 33.3 inches of precipitation each year with 36.6 inches of snow.
| Stat | Livonia |
|---|---|
| Average Annual High | 58.8 |
| Average Annual Low | 40.4 |
| Annual Precipitation Days | 73.7 |
| Average Annual Precipitation | 33.3 |
| Average Annual Snowfall | 36.6 |
Average High
Days of Rain
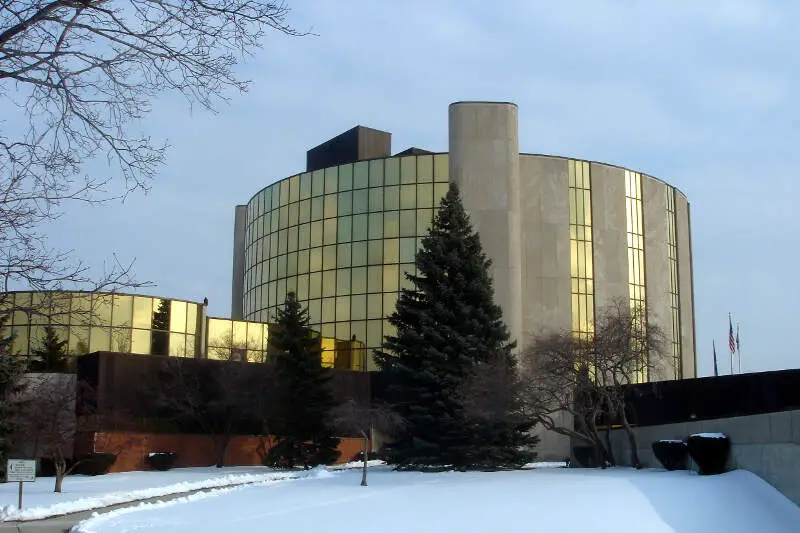
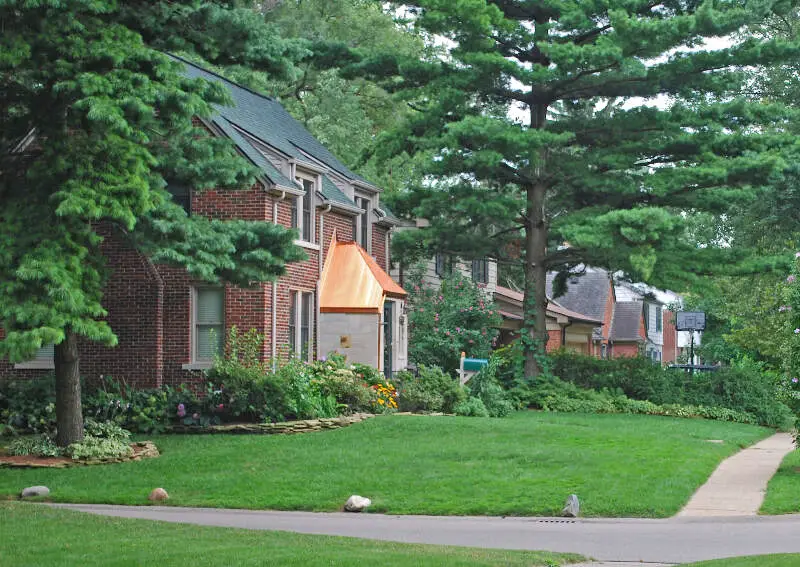
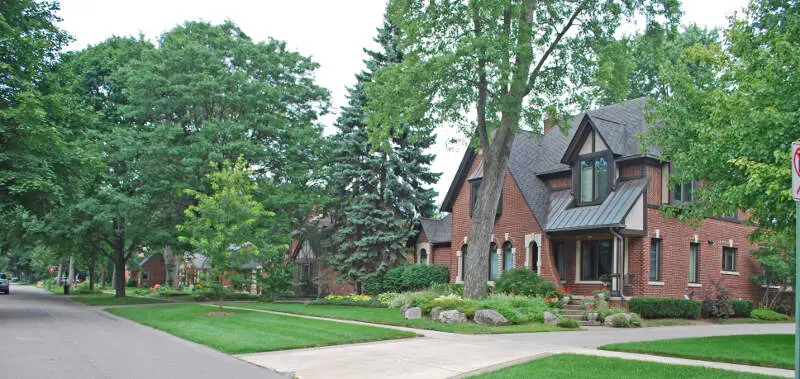
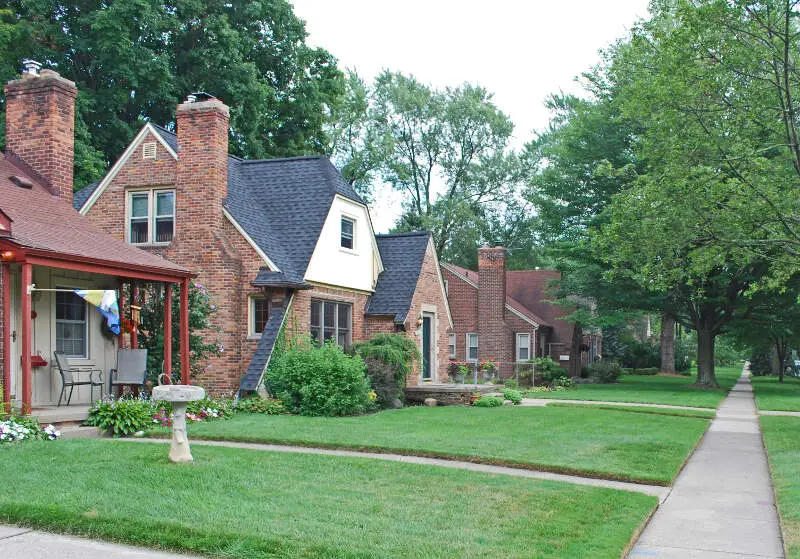
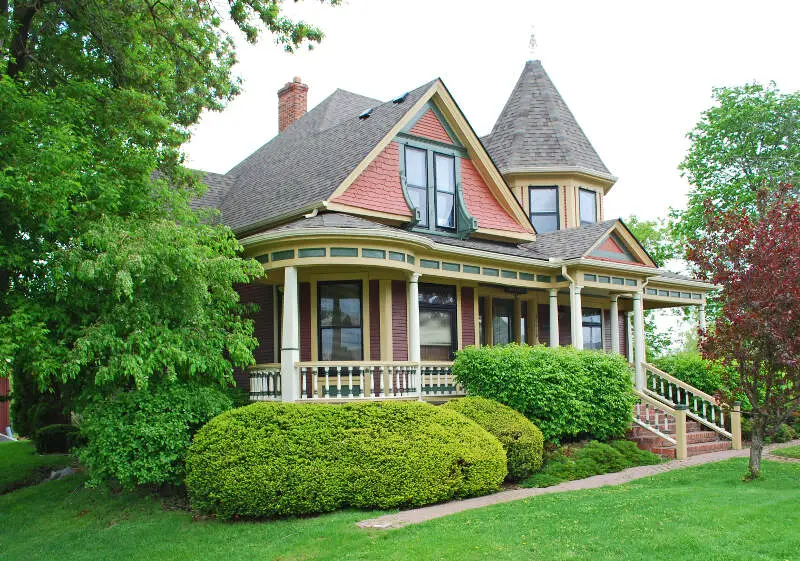
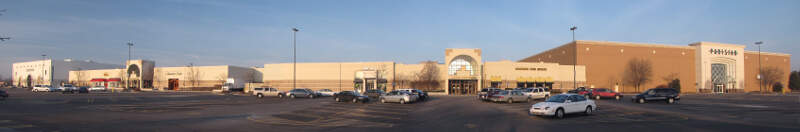
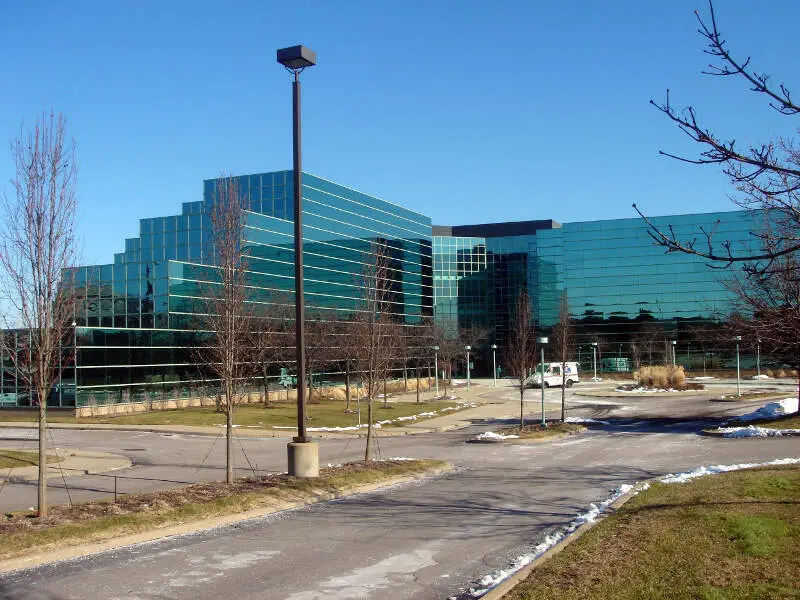
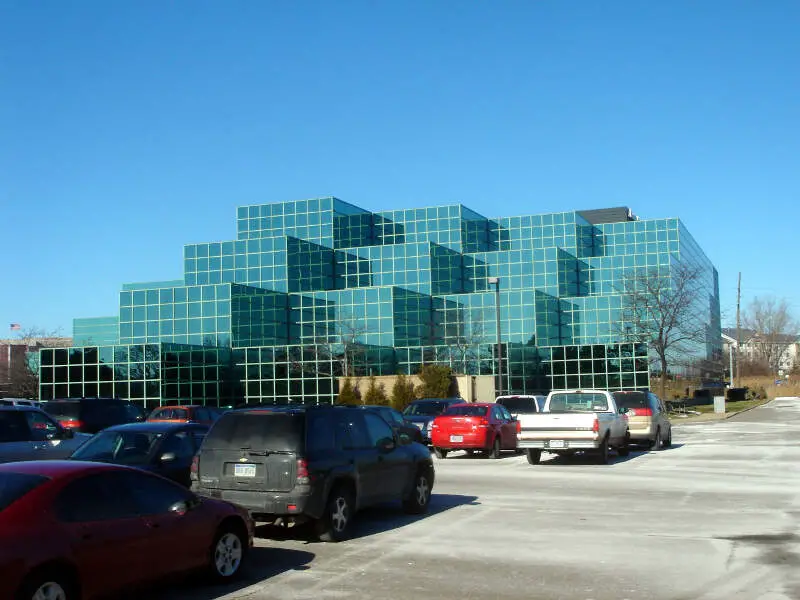
Livonia, MI Photos

Rankings for Livonia in Michigan


Locations Around Livonia
Map Of Livonia, MI
Best Places Around Livonia
Royal Oak, MI
Population 57,880
Birmingham, MI
Population 21,612
Plymouth, MI
Population 9,234
Berkley, MI
Population 15,084
Novi, MI
Population 66,224
Northville, MI
Population 6,080
Huntington Woods, MI
Population 6,322
Troy, MI
Population 87,307
Clawson, MI
Population 11,314
Farmington, MI
Population 11,472
Livonia Demographics And Statistics
Population over time in Livonia
The current population in Livonia is 94,058. The population has decreased -3.9% from 2010.
| Year | Population | % Change |
|---|---|---|
| 2023 | 94,058 | -0.9% |
| 2022 | 94,928 | -0.4% |
| 2021 | 95,294 | 1.4% |
| 2020 | 93,970 | -0.3% |
| 2019 | 94,249 | -0.3% |
| 2018 | 94,567 | -0.1% |
| 2017 | 94,708 | -0.1% |
| 2016 | 94,849 | -0.5% |
| 2015 | 95,312 | -0.6% |
| 2014 | 95,888 | -0.4% |
| 2013 | 96,233 | -0.4% |
| 2012 | 96,632 | -0.6% |
| 2011 | 97,214 | -0.7% |
| 2010 | 97,915 | - |
Race / Ethnicity in Livonia
Livonia is:
82.6% White with 77,685 White residents.
4.3% African American with 4,060 African American residents.
0.1% American Indian with 70 American Indian residents.
3.7% Asian with 3,482 Asian residents.
0.0% Hawaiian with 0 Hawaiian residents.
0.6% Other with 557 Other residents.
4.2% Two Or More with 3,927 Two Or More residents.
4.5% Hispanic with 4,277 Hispanic residents.
| Race | Livonia | MI | USA |
|---|---|---|---|
| White | 82.6% | 73.0% | 58.2% |
| African American | 4.3% | 13.2% | 12.0% |
| American Indian | 0.1% | 0.3% | 0.5% |
| Asian | 3.7% | 3.3% | 5.7% |
| Hawaiian | 0.0% | 0.0% | 0.2% |
| Other | 0.6% | 0.4% | 0.5% |
| Two Or More | 4.2% | 4.1% | 3.9% |
| Hispanic | 4.5% | 5.7% | 19.0% |
Gender in Livonia
Livonia is 50.5% female with 47,513 female residents.
Livonia is 49.5% male with 46,545 male residents.
| Gender | Livonia | MI | USA |
|---|---|---|---|
| Female | 50.5% | 50.4% | 50.5% |
| Male | 49.5% | 49.6% | 49.5% |
Highest level of educational attainment in Livonia for adults over 25
2.0% of adults in Livonia completed < 9th grade.
3.0% of adults in Livonia completed 9-12th grade.
22.0% of adults in Livonia completed high school / ged.
22.0% of adults in Livonia completed some college.
11.0% of adults in Livonia completed associate's degree.
26.0% of adults in Livonia completed bachelor's degree.
11.0% of adults in Livonia completed master's degree.
2.0% of adults in Livonia completed professional degree.
1.0% of adults in Livonia completed doctorate degree.
| Education | Livonia | MI | USA |
|---|---|---|---|
| < 9th Grade | 2.0% | 3.0% | 5.0% |
| 9-12th Grade | 3.0% | 6.0% | 6.0% |
| High School / GED | 22.0% | 28.0% | 26.0% |
| Some College | 22.0% | 22.0% | 19.0% |
| Associate's Degree | 11.0% | 10.0% | 9.0% |
| Bachelor's Degree | 26.0% | 19.0% | 21.0% |
| Master's Degree | 11.0% | 9.0% | 10.0% |
| Professional Degree | 2.0% | 2.0% | 2.0% |
| Doctorate Degree | 1.0% | 1.0% | 2.0% |
Household Income For Livonia, Michigan
2.9% of households in Livonia earn Less than $10,000.
2.0% of households in Livonia earn $10,000 to $14,999.
3.6% of households in Livonia earn $15,000 to $24,999.
4.3% of households in Livonia earn $25,000 to $34,999.
9.0% of households in Livonia earn $35,000 to $49,999.
14.7% of households in Livonia earn $50,000 to $74,999.
15.8% of households in Livonia earn $75,000 to $99,999.
22.8% of households in Livonia earn $100,000 to $149,999.
14.1% of households in Livonia earn $150,000 to $199,999.
10.8% of households in Livonia earn $200,000 or more.
| Income | Livonia | MI | USA |
|---|---|---|---|
| Less than $10,000 | 2.9% | 5.0% | 4.9% |
| $10,000 to $14,999 | 2.0% | 3.9% | 3.6% |
| $15,000 to $24,999 | 3.6% | 7.1% | 6.6% |
| $25,000 to $34,999 | 4.3% | 7.6% | 6.8% |
| $35,000 to $49,999 | 9.0% | 11.8% | 10.4% |
| $50,000 to $74,999 | 14.7% | 16.9% | 15.7% |
| $75,000 to $99,999 | 15.8% | 13.4% | 12.7% |
| $100,000 to $149,999 | 22.8% | 16.9% | 17.4% |
| $150,000 to $199,999 | 14.1% | 8.3% | 9.3% |
| $200,000 or more | 10.8% | 9.0% | 12.6% |


